Lululemon Athletica Inc. (LULU): Capital Discipline Analysis — Revenue growth amid margin compression and cost expansion

Lululemon demonstrates exceptional capital efficiency with best-in-class ROIC and strong free cash flow conversion, reflecting the company's ability to generate substantial returns on its retail store investments and inventory management in the premium athletic apparel segment. The primary concern centers on capital allocation discipline, where the company scores weakest relative to its operational excellence, suggesting potential inefficiencies in how management deploys excess cash through buybacks, dividends, or growth investments. The B-grade capital discipline profile indicates a high-quality business that warrants a premium valuation, though investors should weigh whether current multiples adequately reflect the gap between the company's strong operational metrics and its more modest capital allocation track record.
Lululemon Athletica Inc. is a high-ROIC apparel - retail company with expanding margins and mixed capital allocation.
Capital Discipline Score: B (68/100)

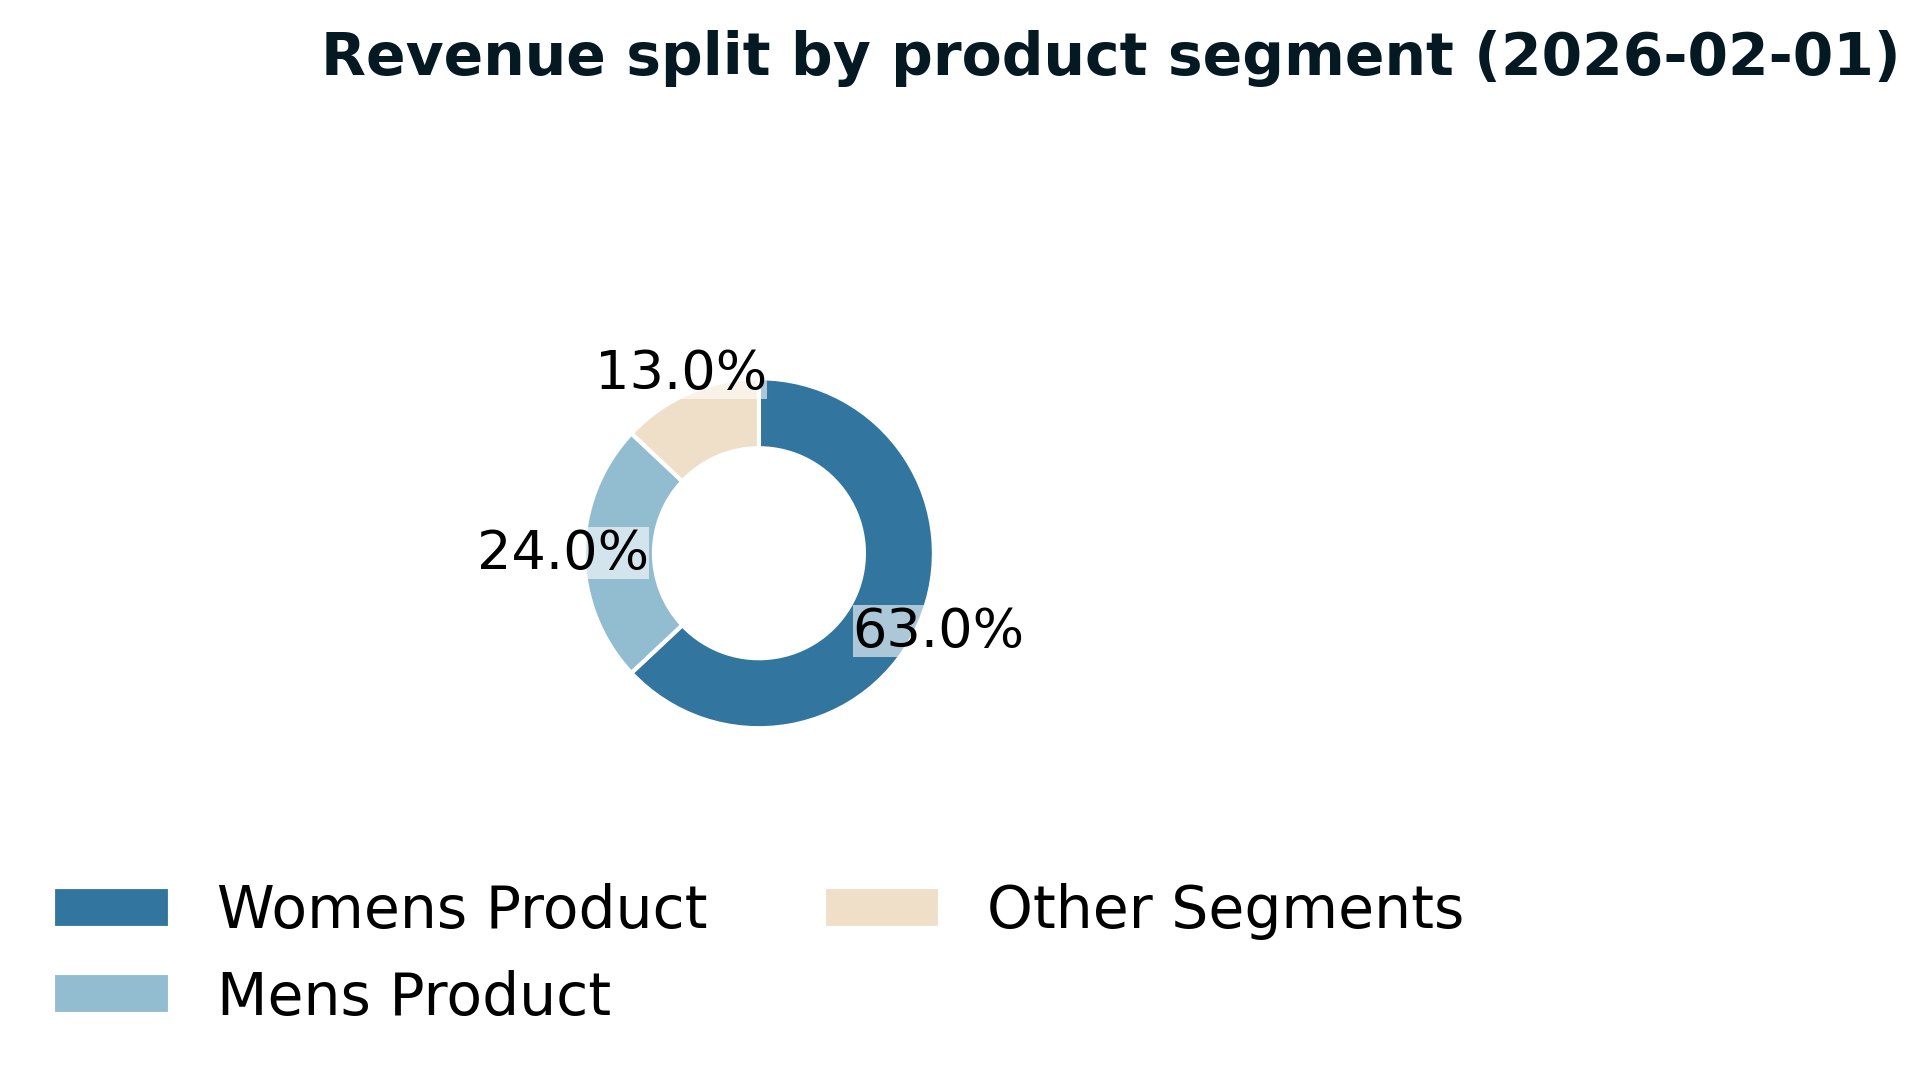
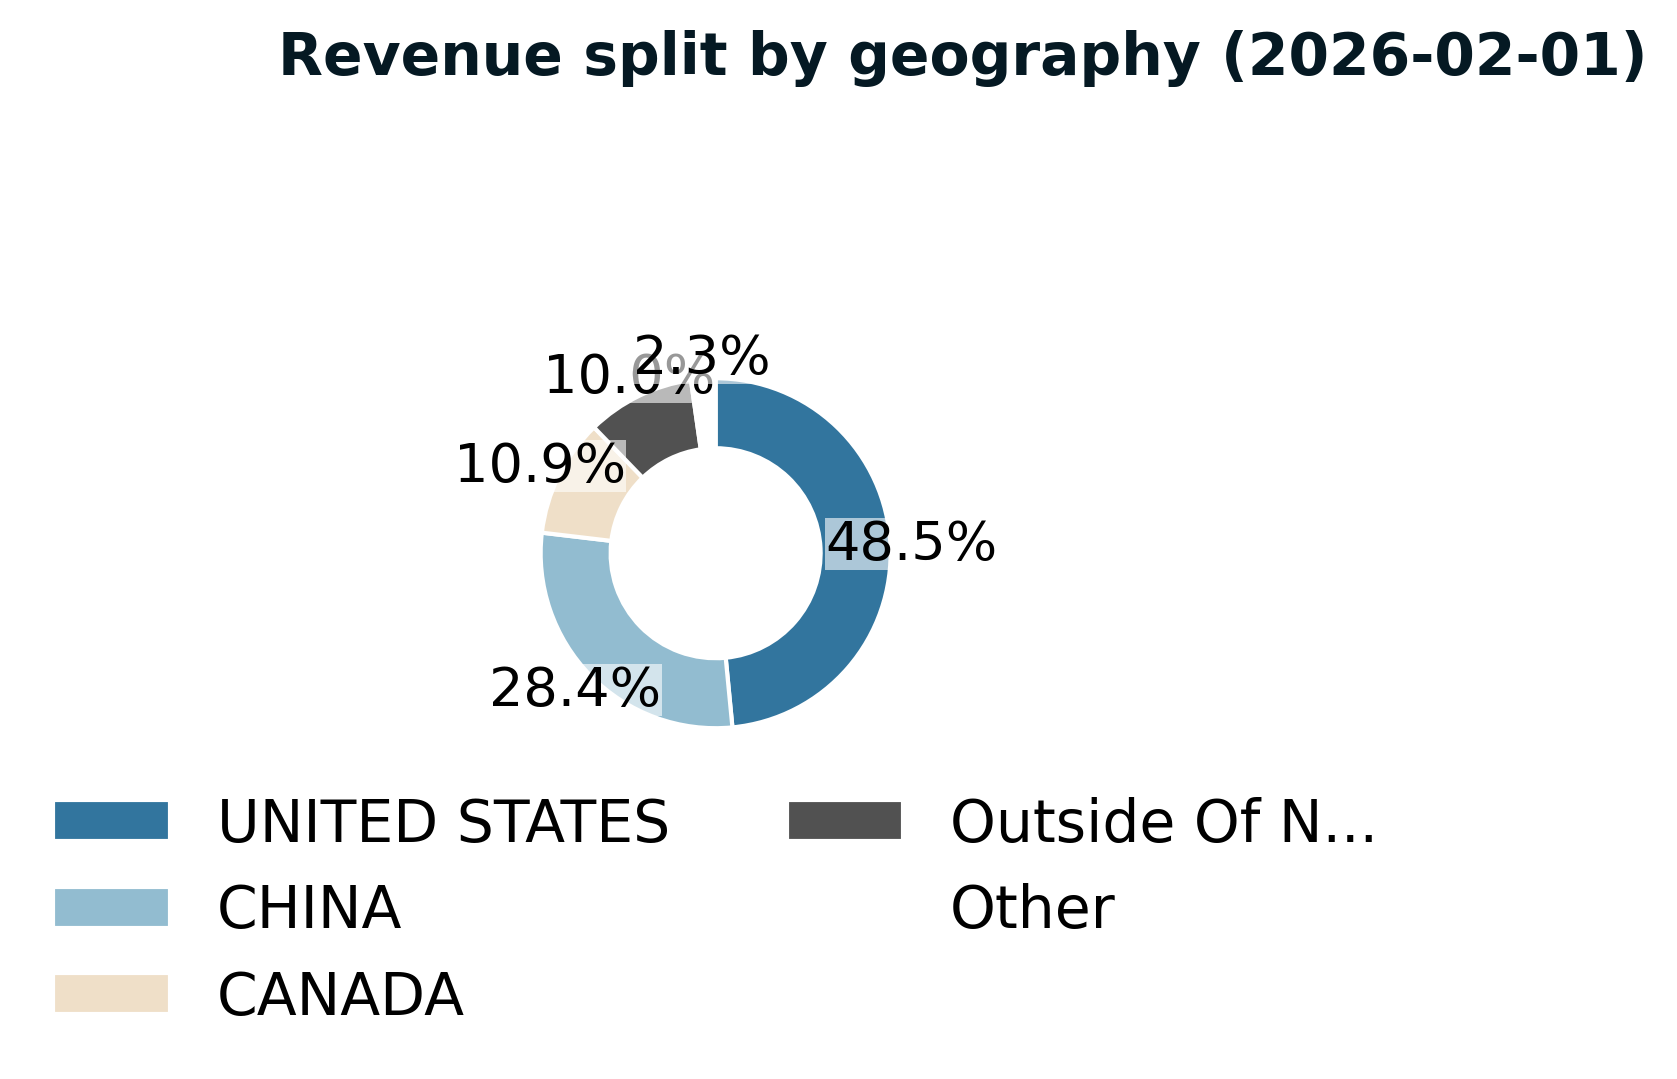
- Operates a global chain of 574 retail stores under the lululemon brand across the United States, Canada, the People's Republic of China, Australia, the United Kingdom, Japan, New Zealand, Germany, South Korea, Singapore, France, Malaysia, Sweden, Ireland, the Netherlands, Norway, and Switzerland, as well as outlets and warehouse sales locations.
- Utilizes a vertically integrated model that channels direct guest feedback into product design and refinement.
- Pools inventory across stores and distribution centers through omni-channel infrastructure to expand fulfillment flexibility and accessible inventory.
- Sells athletic apparel, accessories, and footwear directly to consumers through the lululemon.com e-commerce website and mobile applications.
- Operates an interactive workout platform as part of the digital channel.
- Designs and distributes athletic apparel including pants, shorts, tops, and jackets for women and men, targeted at yoga, running, training, and other fitness activities.
- Offers fitness-related accessories and footwear.
- Distributes products through a network of wholesale accounts including yoga studios, health clubs, and fitness centers, as well as temporary locations and license and supply arrangements.
- Maintains an asset-light production model with no owned manufacturing facilities.
- Founded in 1998 and headquartered in Vancouver, Canada.
Modest Topline Growth Masks Profitability Deterioration

- Revenue rose to $11.1 bn, up 4.9% year-over-year. - Gross profit was flat at $6.3 bn, up just 0.2%. - EBITDA declined to $2.7 bn, down 7.4%. - The divergence between revenue growth and EBITDA contraction signals eroding operating leverage and deteriorating capital efficiency.

- Gross profit ratio declined 4.4pp to 56.6% in 2026, while EBITDA ratio fell 11.6pp to 24.6%. - The sharper contraction in EBITDA relative to gross profit signals deteriorating operating leverage and rising cost absorption. - This compression threatens earnings durability and suggests capital is being deployed less efficiently across the operating base.
Balance Sheet Strength Provides Downturn Cushion

- Debt-to-capital remained stable in 2026, with debt and equity rising in tandem by approximately 14%. - The parallel growth preserved leverage neutrality, suggesting disciplined capital deployment that maintained balance sheet flexibility without eroding equity returns or increasing financial risk.

- ROIC declined 6.5 pp to 22.7% in 2026, driven primarily by lower EBIT. - ROE fell 10.1 pp to 31.8%, reflecting lower net income and higher equity. - The compression in both returns signals weaker capital productivity and suggests diminishing earnings power on the expanded asset base.
Operating Cash Generation Offsets Margin Compression

- Free cash flow declined to $0.9 bn, down 41.8% year-over-year, driven primarily by weaker operating cash flow of $1.6 bn, which fell 29.5%. - Investing cash flow intensified to $-0.7 bn while financing cash flow moderated to $-1.2 bn. - Income quality stood at 1.0, down 19.0%, indicating softer earnings conversion despite net income of $1.6 bn declining only 13.0%. - The sharper contraction in cash generation relative to reported earnings suggests diminishing capital efficiency and raises questions about the sustainability of current profitability levels.

- Acquisitions ceased in 2026 following $0.2 bn deployment in 2025, while capex held steady at $0.7 bn. - Capital allocation was funded primarily through operating cash flow of $1.6 bn, though free cash flow declined to $0.9 bn. - The shift away from acquisitions toward maintenance capex suggests a pivot to earnings preservation over growth investment.

- Stock repurchases totaled $1.2 bn in 2026, down $0.5 bn year-over-year, while operating cash flow declined $0.7 bn to $1.6 bn. - The firm returned 75% of operating cash flow to shareholders despite weaker internal generation, suggesting capital discipline remains prioritized over balance sheet flexibility.
Multiple Compression Reflects Slowing Growth Trajectory

EPS declined 9.5% to $13.3 while the stock fell 56.4% to $179.1, suggesting the market is pricing in material concerns beyond near-term earnings erosion—likely doubting capital productivity or competitive durability.

- EV to EBITDA contracted to 7.8x from 17.1x, while EV to FCF narrowed to 23.1x from 31.8x, both driven primarily by lower enterprise value. - The compression suggests the market is ascribing less value to each unit of operating earnings and cash generation, potentially reflecting concerns over earnings durability or competitive positioning.
Risks & forward signals
- **North America brand health erosion requiring defensive repositioning**: Management has escalated from operational adjustments to a formal action plan focused on premium repositioning and reducing promotional activity, signaling deeper acknowledgment that the core U.S. market has experienced brand dilution and requires fundamental correction before growth can reaccelerate.
- **Merchandising execution gaps undermining product innovation strategy**: Despite product newness remaining the central strategic lever, the company has admitted to missteps in letting lounge and social categories run stale and insufficient agility in balancing core versus new styles, revealing execution risk in translating innovation pipeline into sustained guest engagement.
- **Tariff pressure escalating from background risk to material operational constraint**: Trade policy headwinds have intensified from peripheral concern to active threat requiring supply chain adjustments and pricing strategy recalibration, with management explicitly citing tariffs as impacting guidance and requiring cost discipline to protect margins.
- **Extreme supply chain geographic concentration creates compounding vulnerability**: With two-fifths of production in Vietnam, nearly half from the top five vendors, and no long-term supplier contracts, the company faces layered exposure to country-specific disruptions, vendor capacity constraints, and relationship deterioration in an environment of heightened trade policy uncertainty.
- **International expansion momentum provides growth offset but increases execution complexity**: Continued strength in China and methodical market entry demonstrate geographic diversification progress, yet the simultaneous need to stabilize North America while scaling international operations stretches management focus across divergent market dynamics and maturity stages.
Subscribe to The Compounder Report for weekly capital discipline analysis of S&P 500 companies.