Airbnb, Inc. (ABNB): Growth under elevated investment intensity

Airbnb, Inc. (ABNB): FY2025 FY analysis of earnings as of 2025-12-31
Source: company filings.
Access the complete report in PDF presentation format, with detailed charts and long-term value investing insights:
Download the full PDF presentation
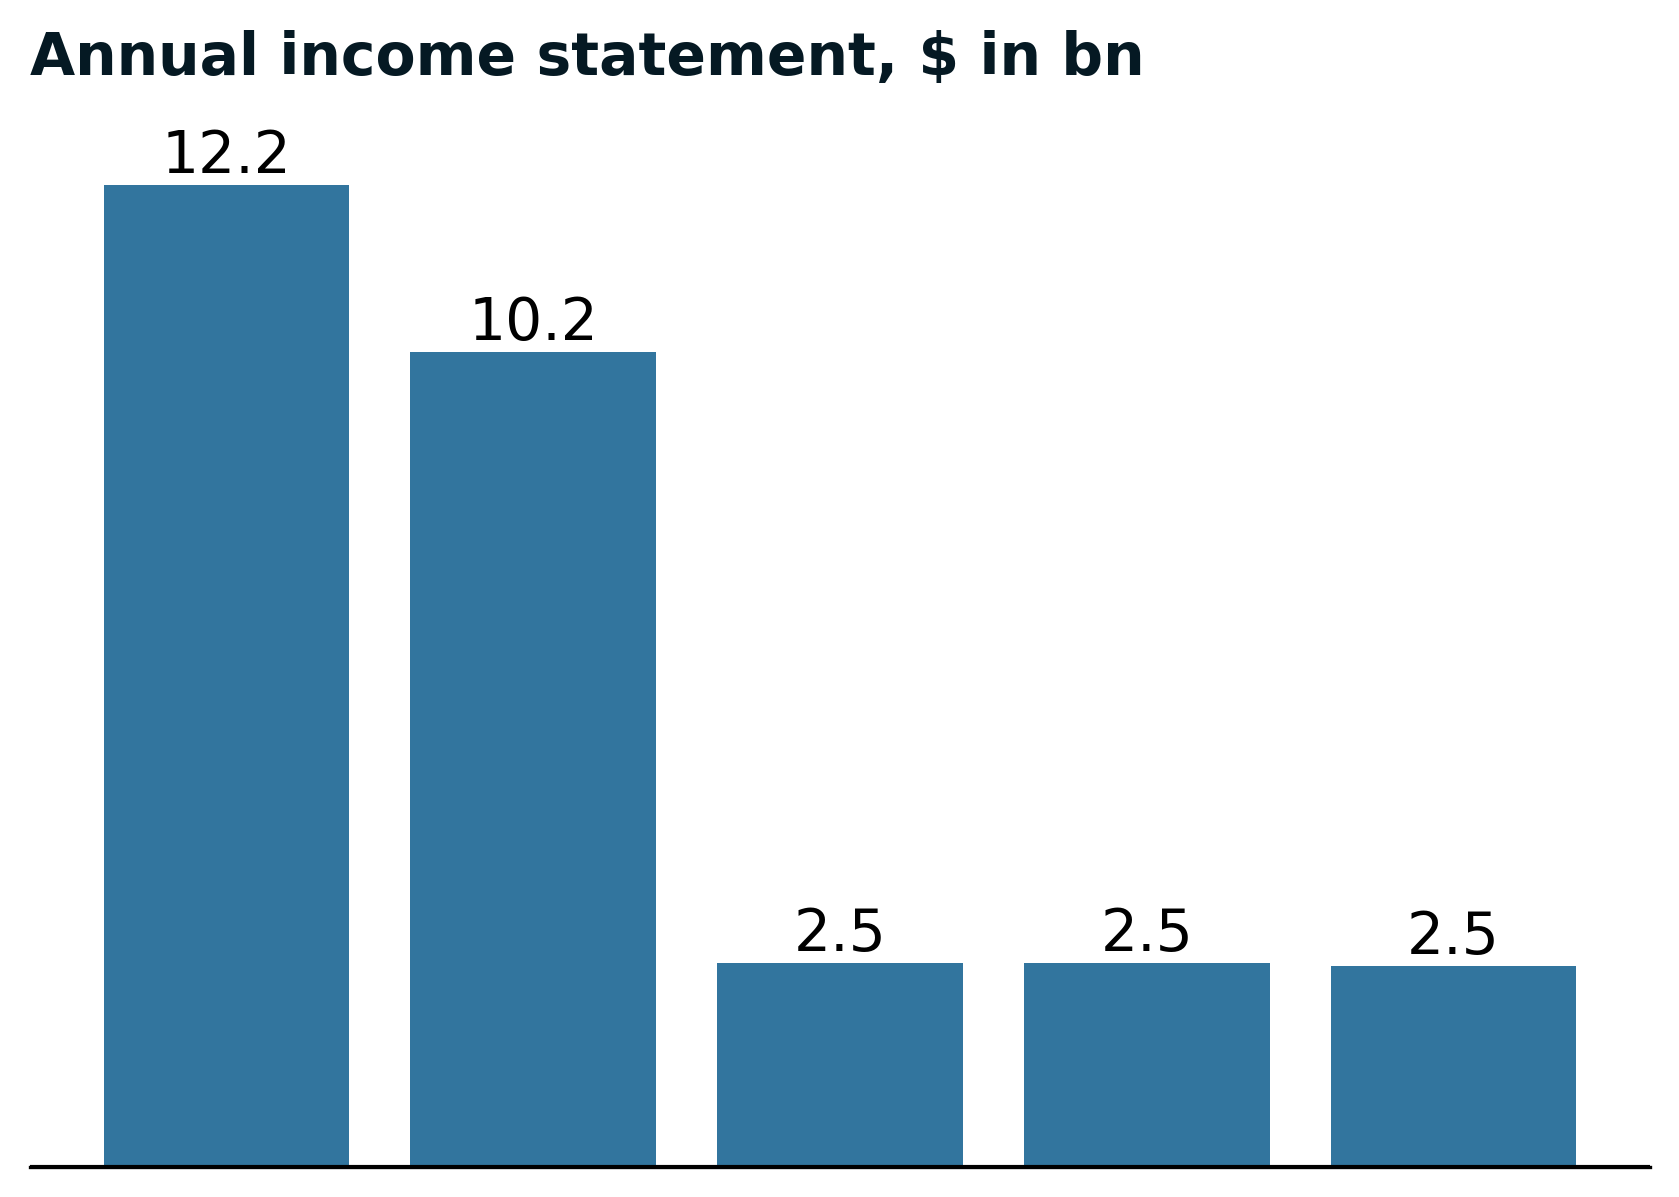
Headline figures 2025, $ in bn
Business description
Financial performance
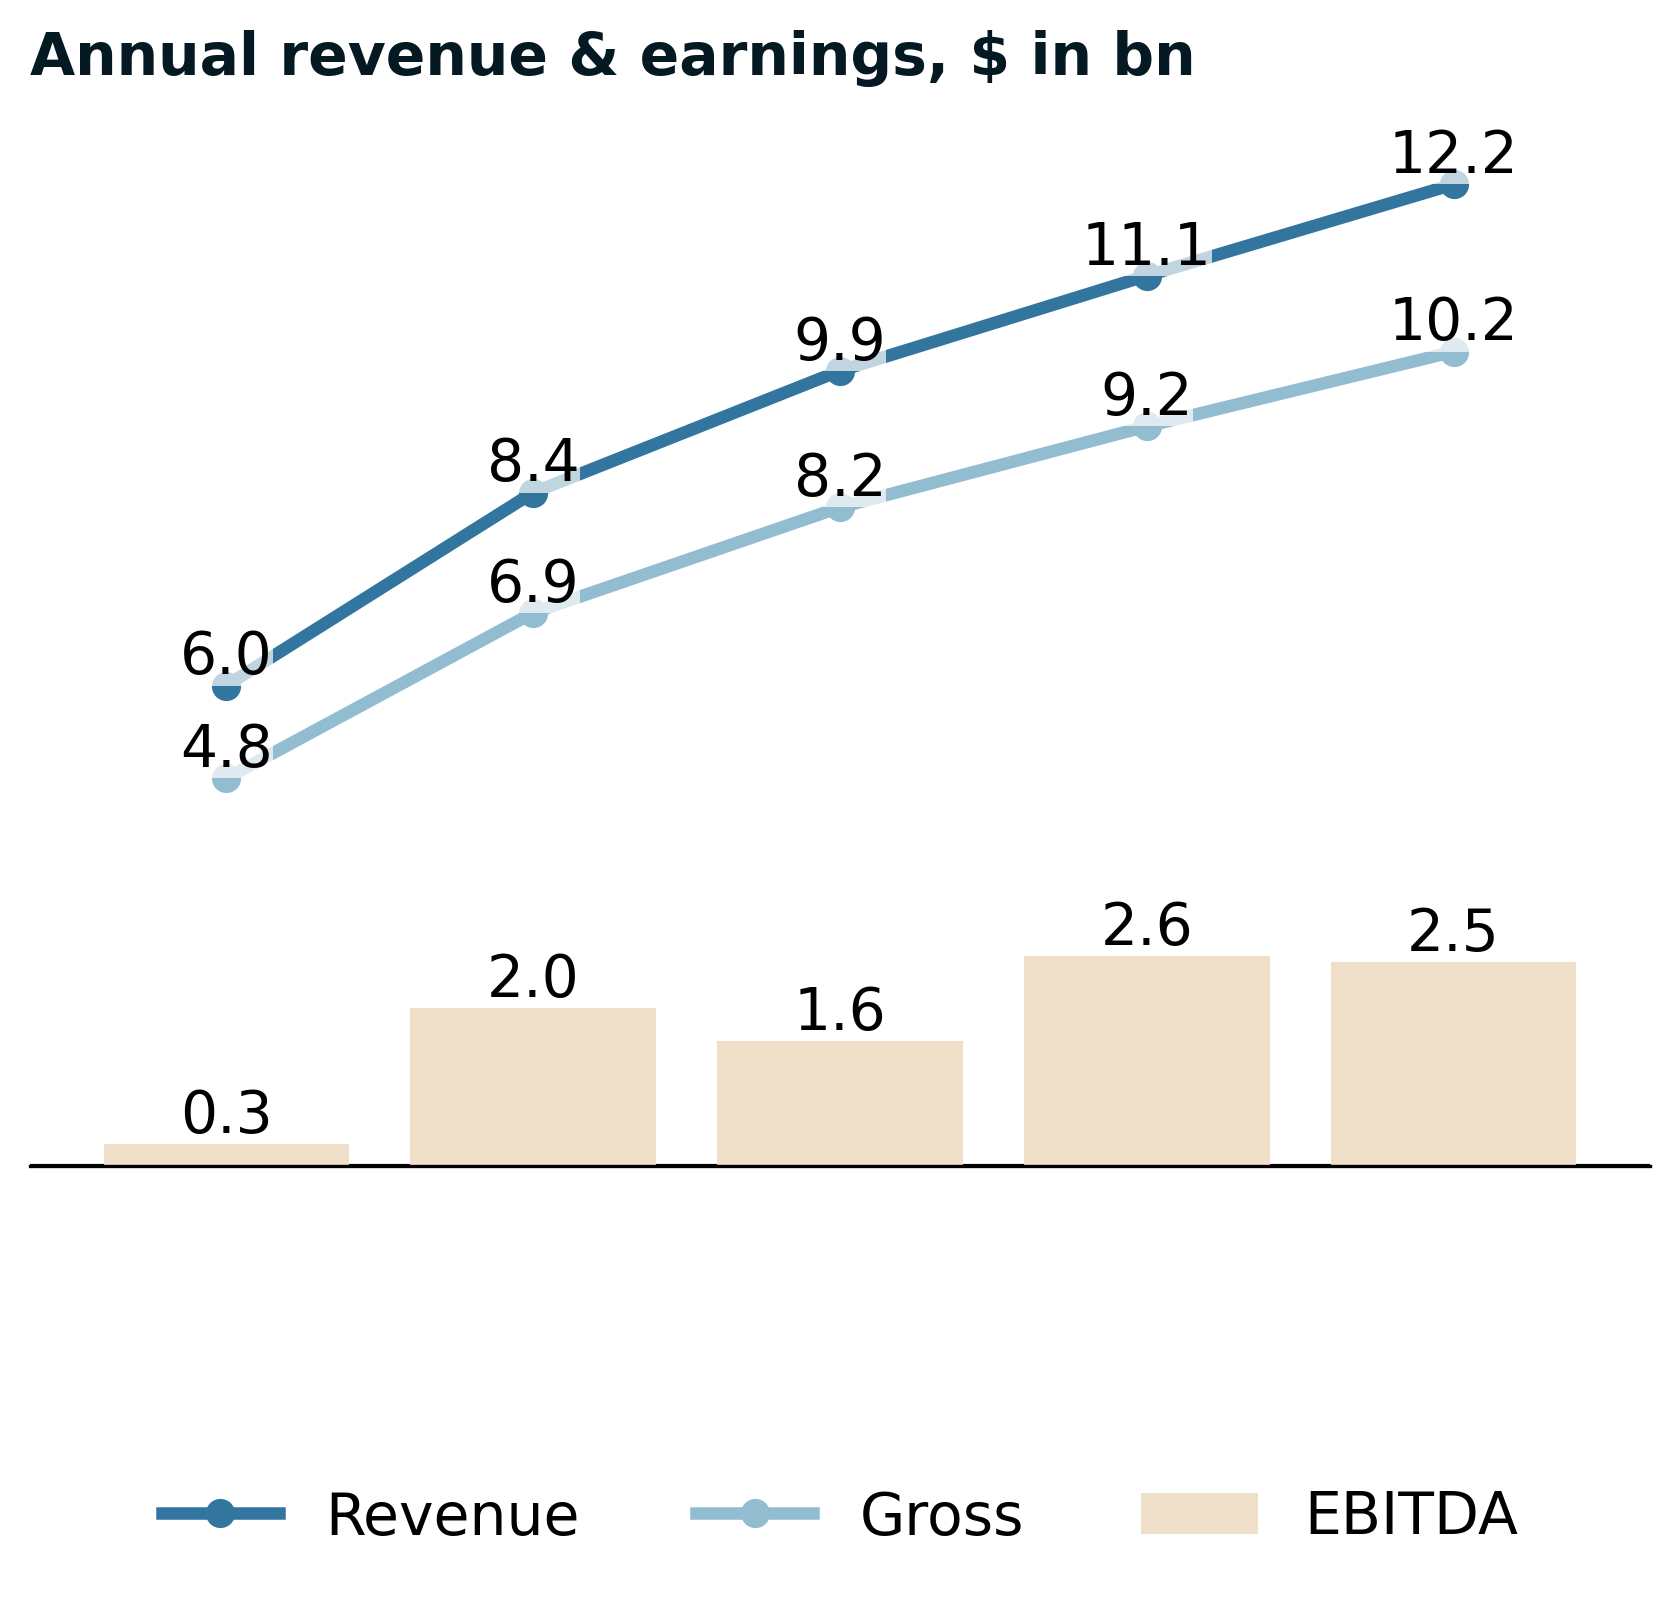

Management on top line and margins
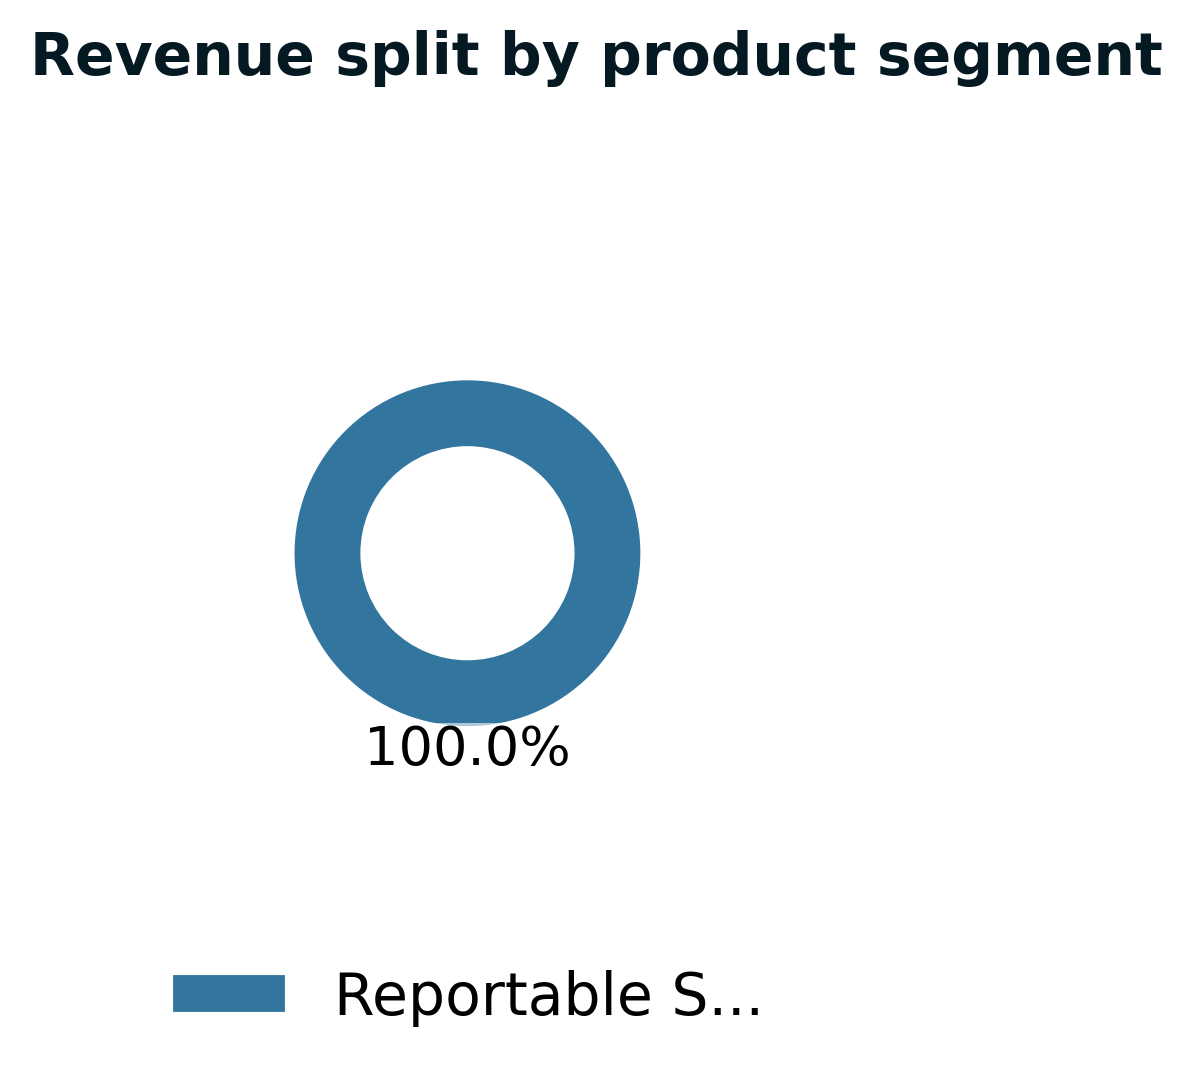
- The platform expanded beyond core accommodations by launching redesigned experiences and Airbnb Services in May, creating additional revenue streams beyond the dominant stays business.
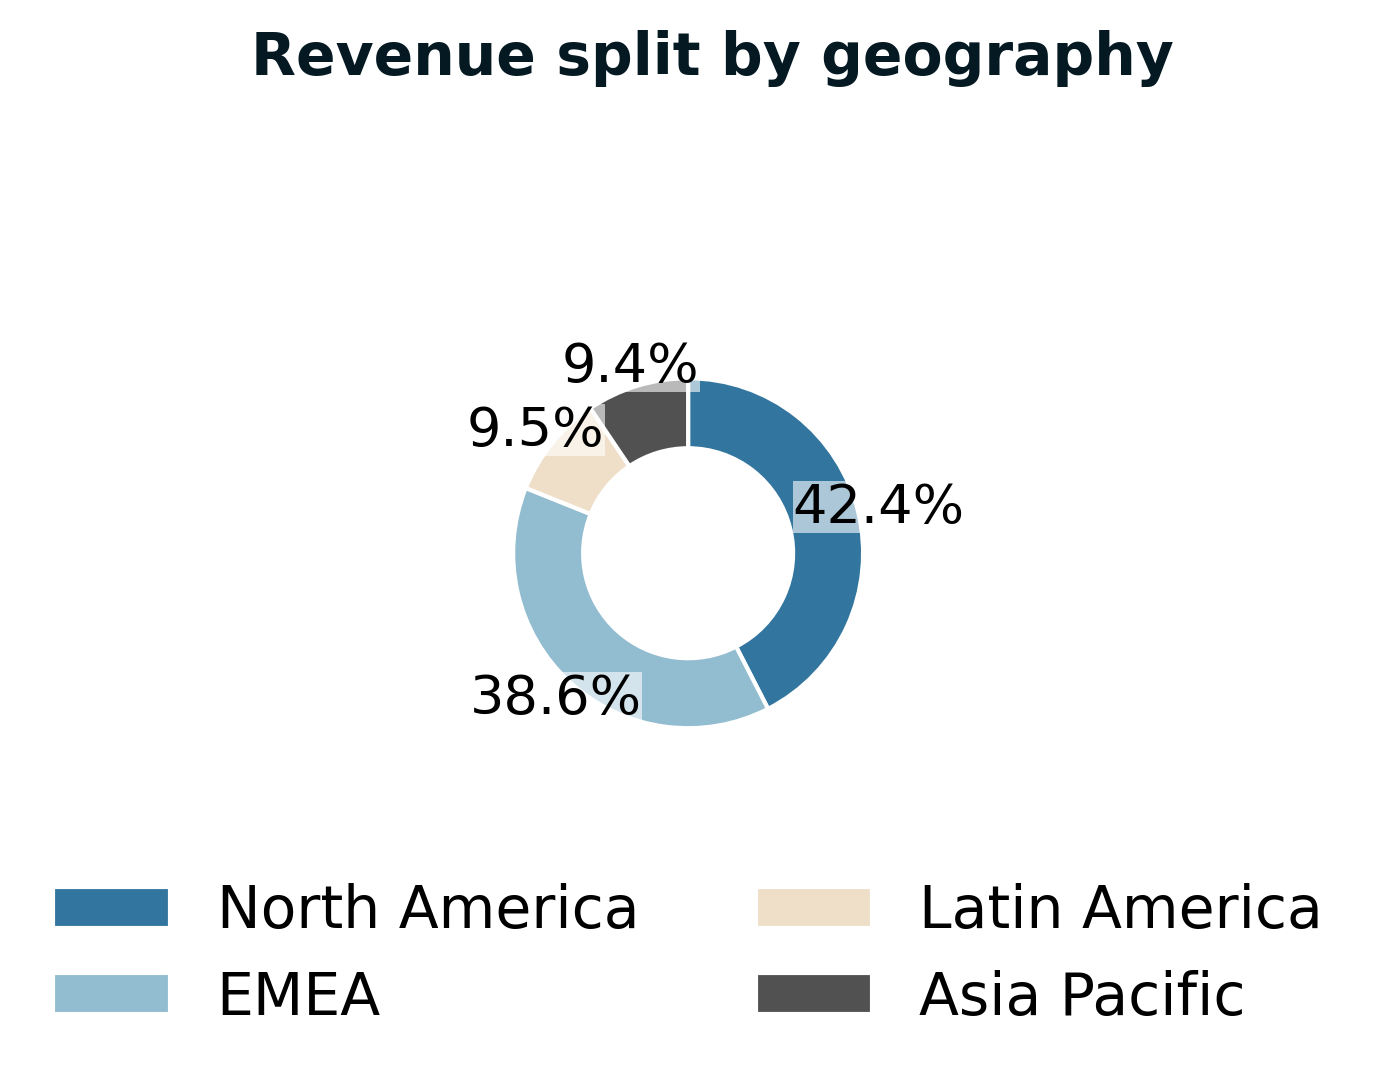
- Geographic mix shifts influenced revenue performance, with EMEA delivering stronger Average Daily Rate growth than other regions during the period.
- Increased compensation expense and elevated marketing spend investments compressed net income despite revenue growth.
- Stock-based compensation represented significant non-cash expense that pressured reported profitability margins.
Annual report executive recap
Strategy & operating model
- # Strategy & Operating Model
- The company completed a substantial technology stack rebuild during the year, transitioning to microservices architecture that enabled independent service deployment and scaling while maintaining stability and correctness.
- Management launched the Co-Host Network, creating a marketplace-within-marketplace that connected inexperienced hosts with experienced co-hosts who provided personalized support ranging from listing setup to booking management and guest communication.
Supply chain & operational footprint drivers
- The company employed approximately eighty-two hundred internal employees and relied on a global network of approximately thirteen thousand third-party workers who supported the majority of community support contacts.
- Management implemented a Live and Work Anywhere policy that allowed the vast majority of employees to work remotely, expanding the talent pool beyond physical office commuting range.
- Internal community support employees focused on managing complex and sensitive issues while enablement teams supported all community-facing teams and partners.
Transactions, portfolio actions & major strategic initiatives
- The company substantially completed a technology stack rebuild during the year, enhancing scalability, reliability, and innovation pace while maintaining platform stability and correctness.
- Management launched redesigned experiences and expanded the Co-Host Network in May, creating a marketplace-within-marketplace dynamic connecting inexperienced hosts with experienced co-hosts for personalized support ranging from listing setup to booking management.
Risk factors & forward-looking signals
- # RISKS & UNCERTAINTIES
- Criminal, violent, or fraudulent actions by hosts or guests threatened platform trust and could trigger immediate booking declines, long-term brand damage, and simultaneous supply-demand attrition affecting transaction volume and revenue.
- Management acknowledged potential macroeconomic and geopolitical headwinds including inflation, interest rates, foreign currency fluctuations, tariffs, trade controls, and decreased consumer spending, though no material impact had been observed to date.
Earnings call executive recap & narrative evolution
Consistent strategic themes
- Management has maintained unwavering commitment to three growth levers—perfecting core service, expanding geographically into underpenetrated markets, and broadening beyond accommodations—with this framework appearing identically across every call as the organizing principle for all strategic decisions.
- The platform rebuild and new technology stack remain the foundational enabler throughout, consistently framed as unlocking speed, iteration capability, and extensibility required for the multi-product vision.
Intensifying or reinforced signals
- AI integration evolved from future consideration to active execution with senior leadership recruitment, shifting from generic feature additions to building AI-native experiences that reinforce the real-world connection philosophy rather than replacing human interaction.
- International expansion markets growing at double the rate of core markets transitioned from emerging observation to validated playbook, with management increasingly confident in replicating localized engagement strategies that drove Brazil's breakout success.
Theme drift or shifts in emphasis
- Margin narrative shifted from accepting near-term pressure for growth investment toward emphasizing profitable scaling without heavy capital requirements, suggesting either faster-than-expected margin recovery or recalibrated investment pacing as new businesses launched.
- Macroeconomic framing moved from cautious monitoring of uncertainty and volatility to acknowledging stronger-than-anticipated conditions, representing a meaningful tonal shift in external environment assessment.
Capital allocation signal evolution
- Share repurchases remained constant throughout as the primary capital return mechanism, with no change in commitment level or philosophical approach despite varying investment cycles.
Risk narrative evolution
- Risk language softened considerably from active monitoring of geopolitical uncertainty and softer trends to generic acknowledgment of travel industry exposures, suggesting diminished concern about demand fragility as momentum built through the period.
Leverage position & capital efficiency


Management on capital structure
- # Balance Sheet, Capital Structure & Liquidity
- The company maintained a strong liquidity position of $11.1 billion in cash, equivalents, and short-term investments plus $7.0 billion in customer funds, supporting an aggressive share repurchase program with substantial remaining authorization capacity.
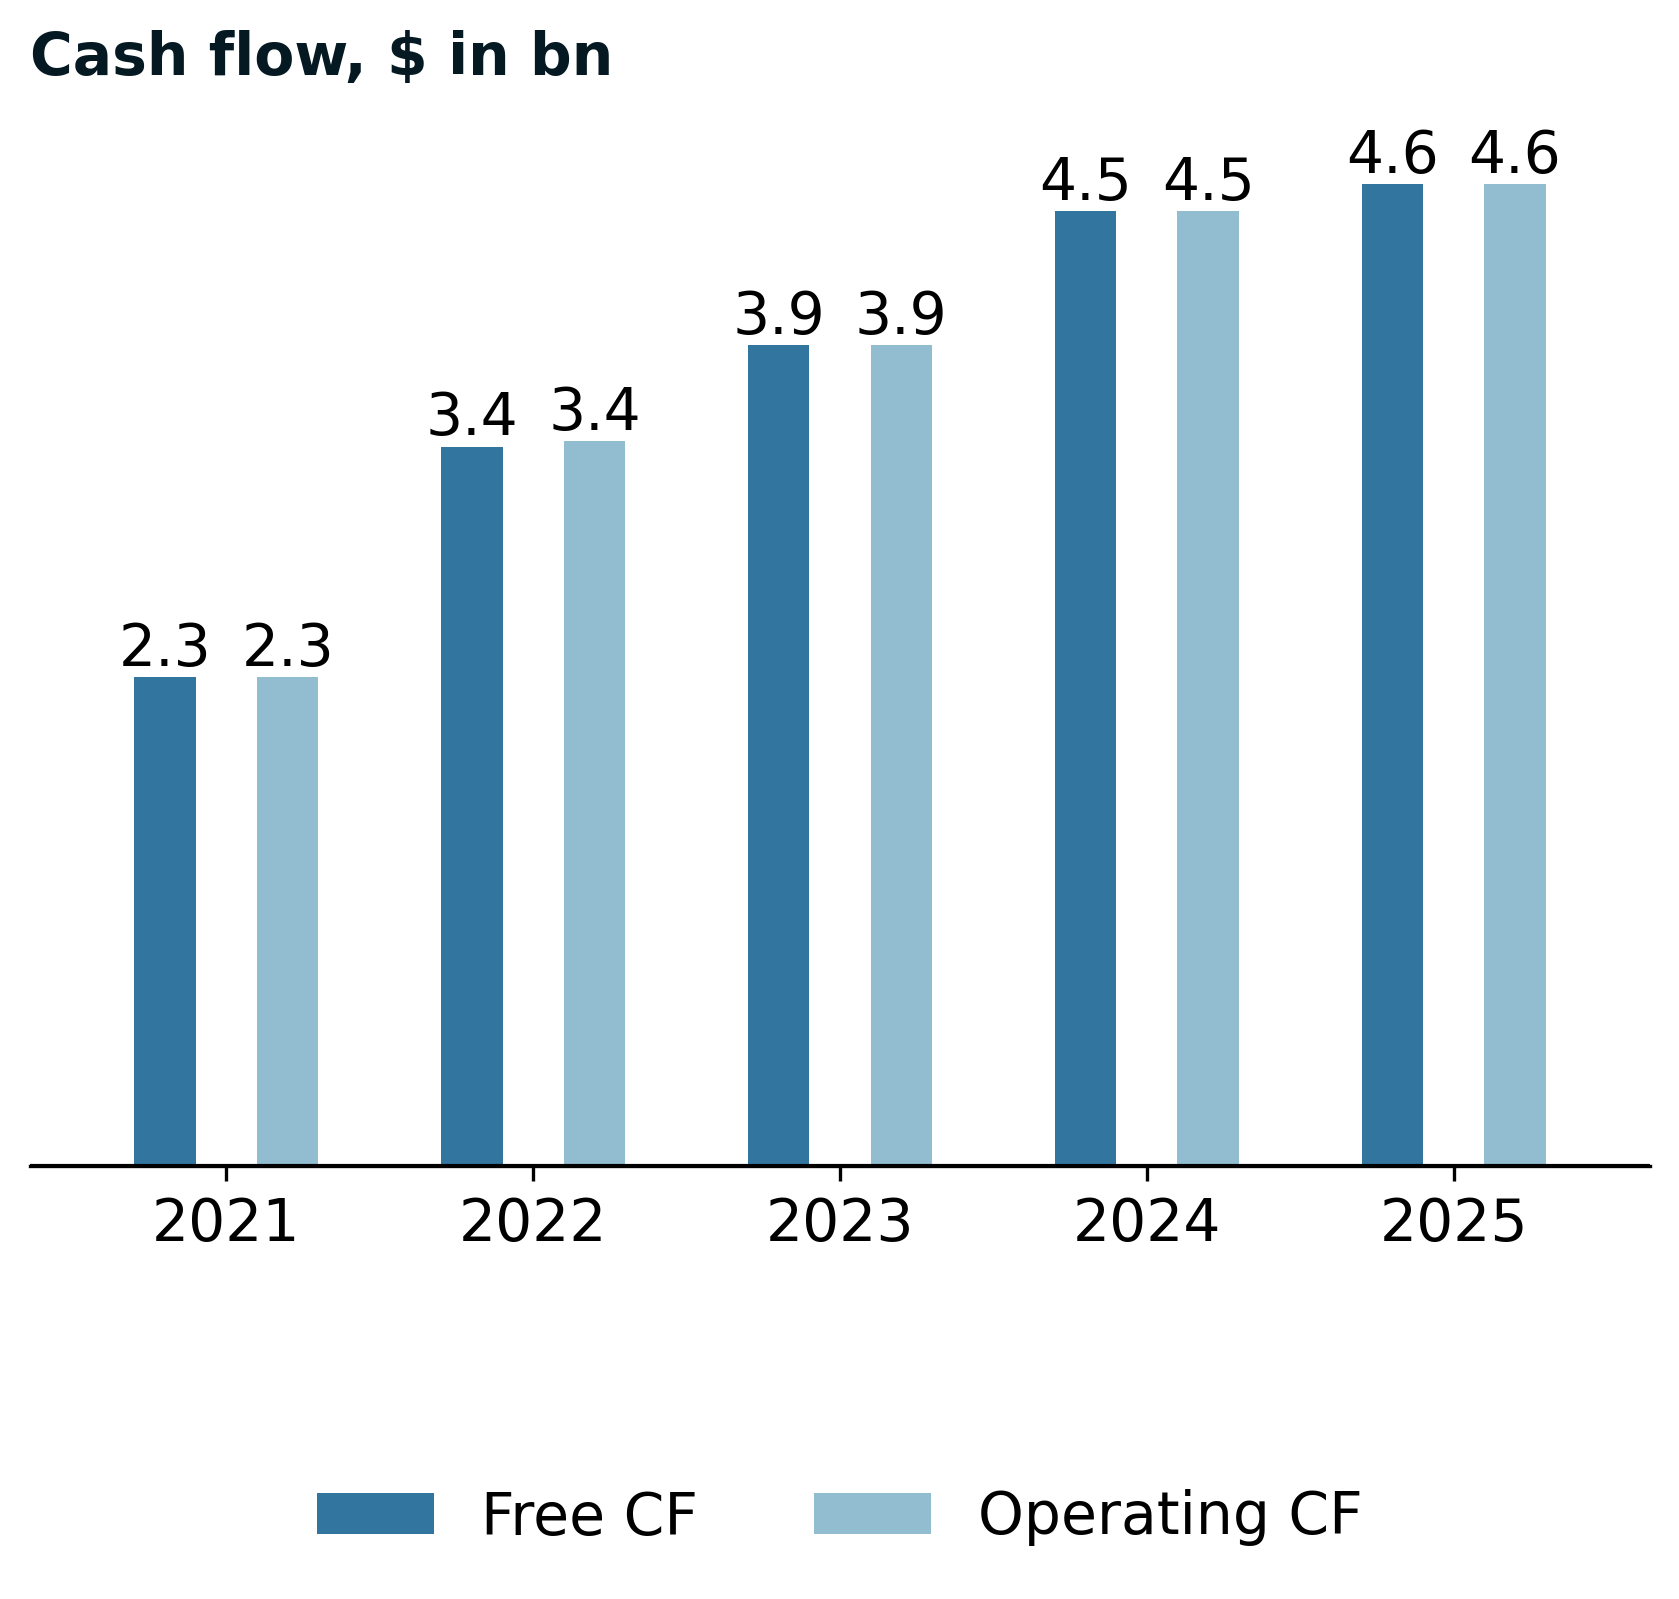
- Operating cash flow increased modestly driven by favorable working capital dynamics from upfront service fee collection at booking before check-in, though elevated compensation expense and marketing investments compressed net income despite revenue growth.
Cash flow and capital allocation


Management on capital allocation
- Operating cash flow increased modestly, driven by revenue growth and favorable working capital timing from collecting Gross Booking Value at booking before check-in, while service fees collected upfront created positive cash dynamics.
- The company executed aggressive share repurchases with substantial remaining authorization capacity, demonstrating commitment to returning capital to shareholders while maintaining strong liquidity for long-term stakeholder benefit.
Valuation (2025-12-31)


Disclaimer
This presentation is for informational and educational purposes only and does not constitute investment advice, an offer, or a solicitation to buy or sell any security or financial product. The content herein is based on publicly available information, believed to be accurate and reliable at the time of publication, but no representation or warranty, express or implied, is made as to its accuracy, completeness, or correctness.
Any opinions, projections, or forward-looking statements expressed in this material reflect our judgment as of the date of publication and are subject to change without notice. Past performance is not indicative of future results. Investing involves risks, including the potential loss of principal.
The recipient is solely responsible for their own investment decisions and should seek independent financial, legal, and tax advice where appropriate. We disclaim any liability for any direct or consequential loss arising from any use of this presentation or its contents.