Visa Inc. (V): Scale payments platform with high cash conversion

Visa Inc. (V): FY2025 FY analysis of earnings as of 2025-09-30
Source: company filings.
Access the complete report in PDF presentation format, with detailed charts and long-term value investing insights:
Download the full PDF presentation
Headline figures 2025, $ in bn

Business description
Corporate Profile:
- Visa Inc. is a payments technology company founded in 1958 and headquartered in San Francisco, California.
- The company operates worldwide in the financial services sector, focusing on credit and other electronic payment services.
- It provides its services under the Visa, Visa Electron, Interlink, VPAY, and PLUS brands.
Transaction Processing Network:
- The company operates VisaNet, a global transaction processing network that enables authorization, clearing, and settlement of payment transactions.
- VisaNet processes Visa‑branded and certain non‑Visa‑branded transactions for issuers and acquirers without taking credit risk.
Consumer Payments:
- The company facilitates digital payments between consumers, merchants, financial institutions, businesses, strategic partners, and government entities.
- It offers card products and platforms that support consumer credit, debit, and prepaid payment transactions.
Commercial and Money Movement Solutions:
- The company provides commercial payment and money movement solutions that enable businesses and other institutional clients to send and receive funds.
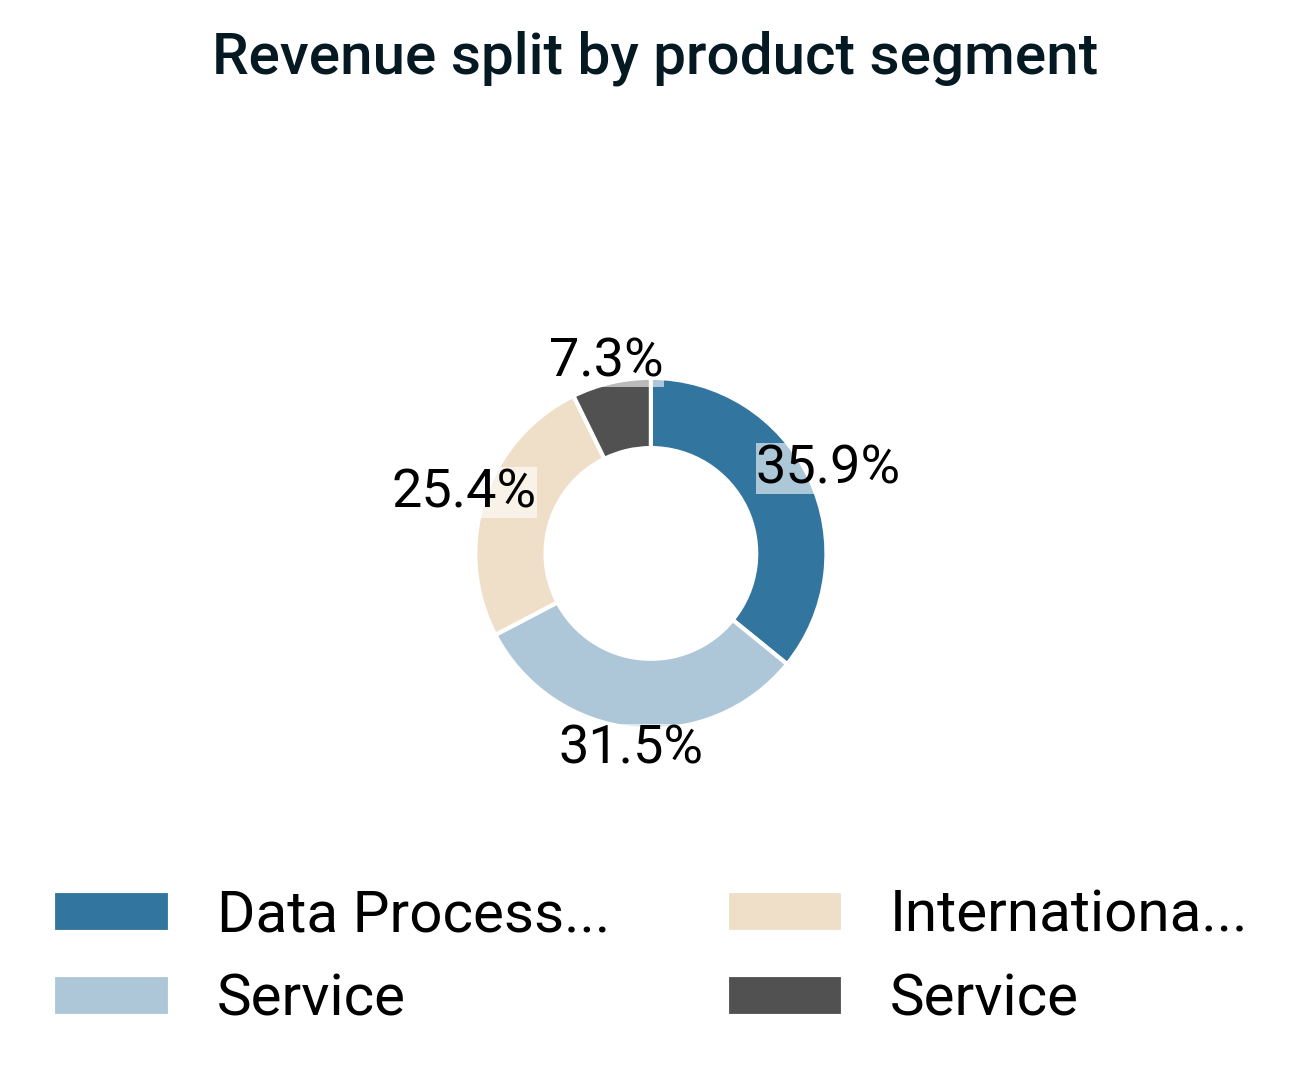
- These solutions monetize service, data processing, and international transaction activities related to commercial payments.
Value-Added Services:
- The company offers value‑added services, including data processing and other ancillary services, that support and enhance payment transactions.
- It monetizes value‑added services across its Consumer Payments and Commercial & Money Movement Solutions pillars.
Technology Platforms:
- The company uses modular, API‑driven platforms, including Visa as a Service, issuer processing, core banking, open banking, and Visa Direct, to deliver its services.
- These platforms integrate into client workflows and are supported by global data centers and reusable services.
Financial performance
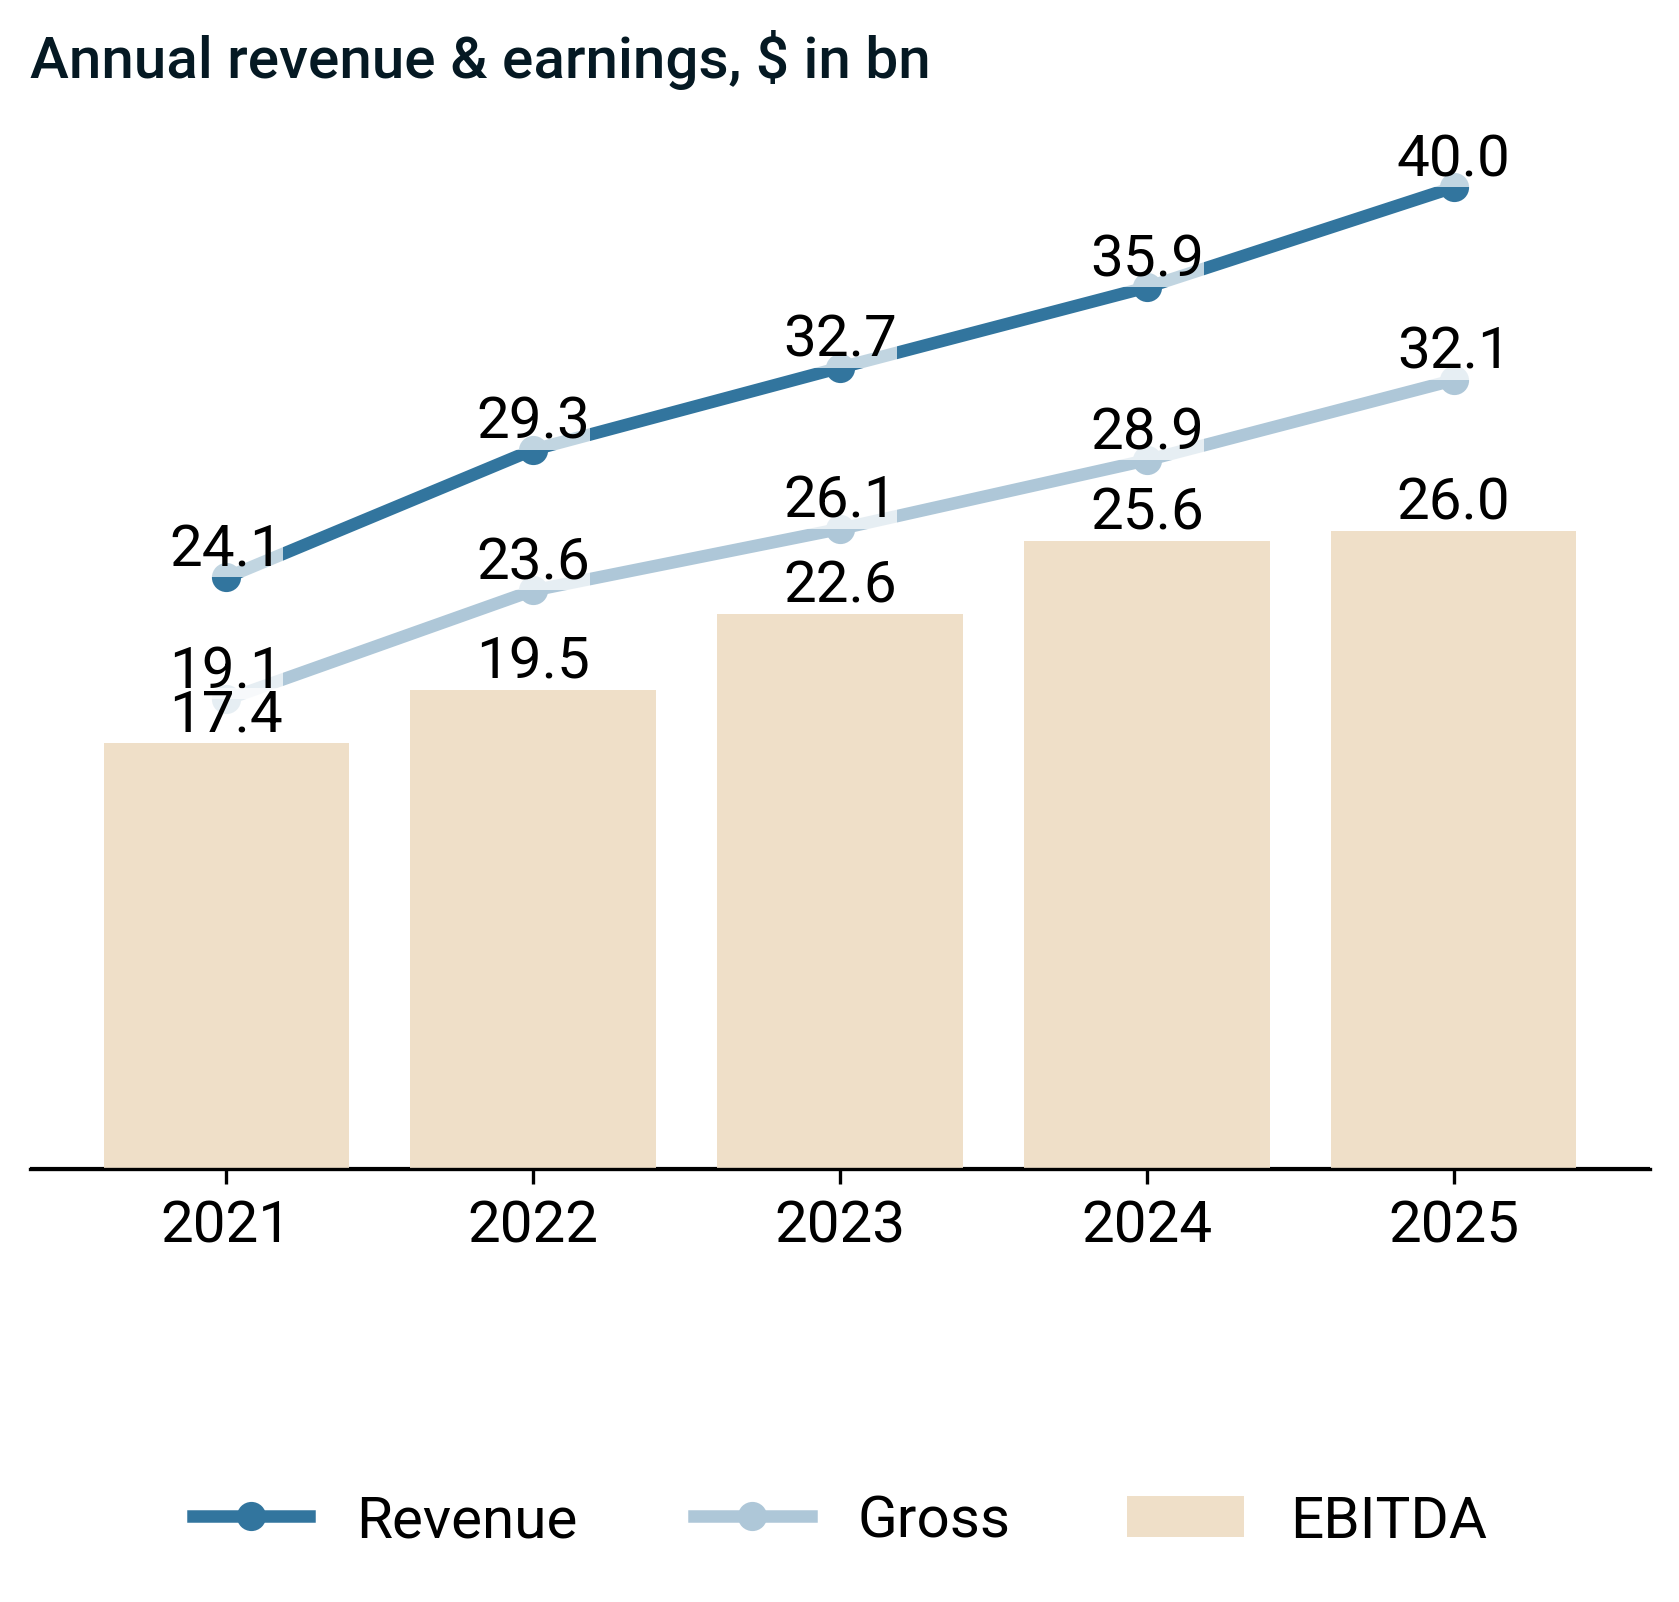
- Revenue rose 11.3% to $40.0 bn, with gross profit up 11.3% to $32.1 bn, indicating stable margin structure.
- EBITDA grew 1.6% to $26.0 bn, lagging revenue expansion.

- Gross profit ratio held at 80.4%, flat year over year and above historical norms, indicating resilient unit economics.
- EBITDA ratio fell 6.2pp to 65.0%, now below historical norms, primarily driven by weaker cost leverage.
Management on top line and margins
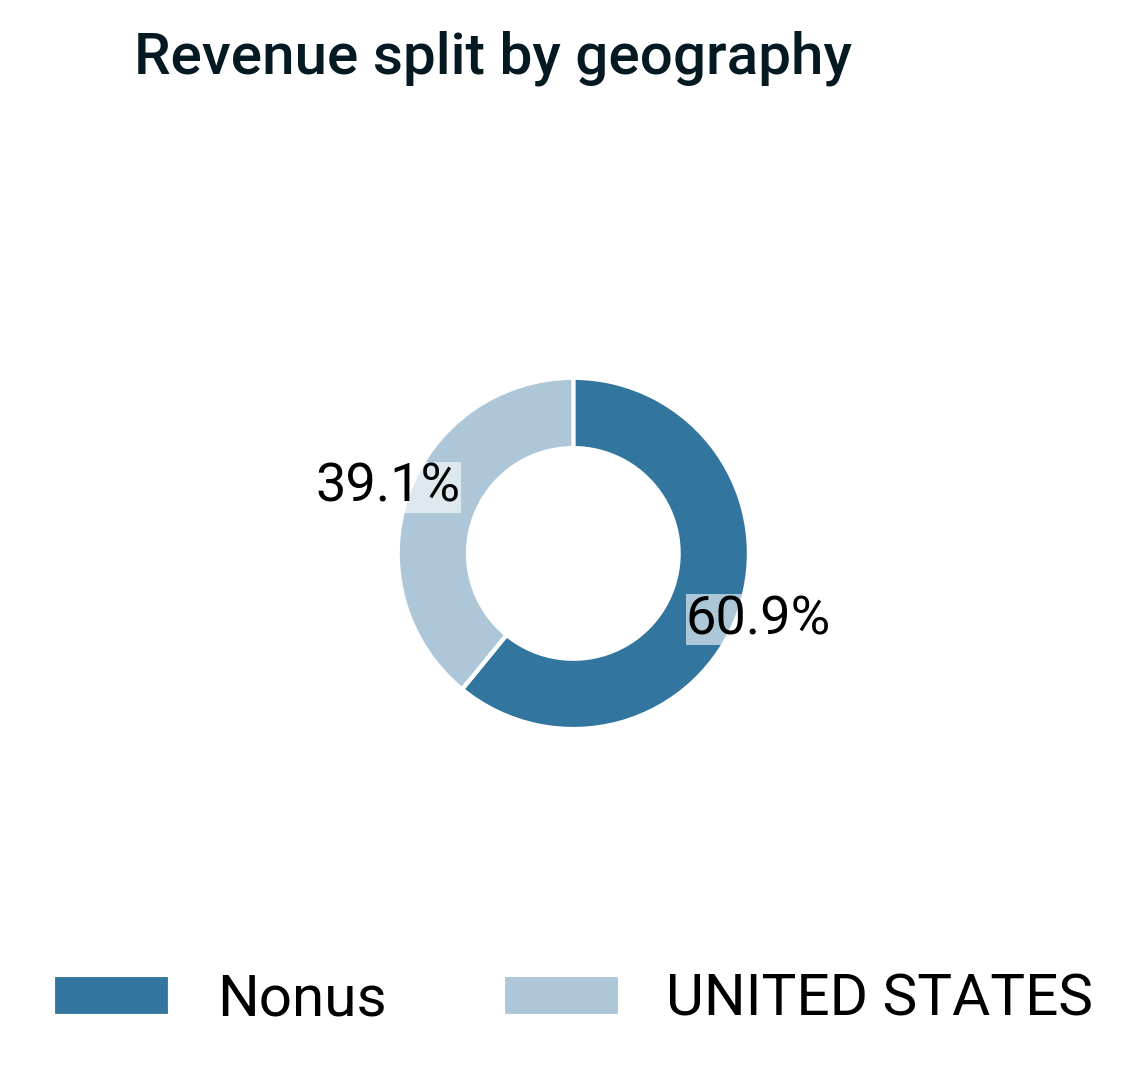
- Revenue increased as higher processed transactions, nominal payments volume, cross‑border travel and ecommerce, affluent and B2B flows, and deeper value‑added services penetration expanded service, data processing, international and other revenue, aided by pricing modifications and growth in advisory and other services.
- Revenue was constrained as regulatory caps on interchange, routing mandates, domestic schemes, data localization, evolving privacy/AI rules, higher client incentives, and fragmented local operating models pressured transaction volume, mix, pricing power and data monetization.
- High operating leverage from VisaNet, reusable services, and software-like issuer processing and VAS structurally expanded margins by spreading fixed technology and data center costs over rising transaction and service volumes.
- Rising personnel, marketing, technology investments, depreciation, indirect taxes, and especially litigation provisions structurally compressed reported operating margins, while regulatory fragmentation and compliance requirements constrained further margin expansion.
Annual report executive recap
Strategy & operating model
- Management operationalized strategy through the Visa as a Service and Visa Intelligent Commerce platforms, exposing capabilities via APIs and modular services that partners integrated into their own applications to drive recurring, usage‑based revenue.
- Management embedded with customers by co‑developing and integrating solutions via APIs, SDKs and white‑label offerings, and by using long issuer processing and core banking integration cycles to create high switching costs and durable relationships.
Supply chain & operational footprint drivers
- Visa operated four globally distributed data centers in the U.S., U.K. and Singapore with high redundancy in connectivity, power and cooling, which supported continuous availability of VisaNet and related platforms.
- Visa maintained a large telecommunications infrastructure that underpinned transaction processing, which enhanced network reliability and scalability.
- Visa invested in multi-layer security architecture across its infrastructure, which protected uptime and reduced fraud-related operational disruptions.
Transactions, portfolio actions & major strategic initiatives
- Visa acquired Tink, Earthport, Currencycloud, YellowPepper, Pismo and Featurespace to add open banking, account connectivity, FX and wallet infrastructure, digital wallet connectivity, cloud‑native core banking and AI fraud capabilities, thereby strengthening Visa Direct, issuer processing and value‑added risk and security services.
- Visa integrated these acquisitions as platform and capability bolt‑ons that fed Visa Direct, value‑added services and issuer processing rather than operating them as stand‑alone businesses, which enhanced network effects and scalability.
Risk factors & forward-looking signals
- Management stated that evolving global regulations on interchange, routing, data, AI and cybersecurity, along with market‑access barriers and domestic schemes, could constrain volume growth, compress fees, raise compliance costs and structurally limit margin expansion and capital available for shareholder returns.
- Management indicated that ongoing and potential future litigation, especially U.S. interchange matters, created material uncertainty for earnings, liquidity planning and capital allocation decisions.
Earnings call executive recap & narrative evolution
Consistent strategic themes
- Persistent commitment to a three-engine model (consumer payments, new flows/money movement, value-added services) and to expanding beyond card-only transactions into account-to-account and software-like services.
- Ongoing positioning of Visa as a modular, network-and-software “as a service” platform, with AI, tokenization, and risk tools embedded across offerings and used to deepen client integration.
Intensifying or reinforced signals
- Narrative around Visa as a “payments hyperscaler” and “Visa as a Service” clearly strengthens over time, with increasing emphasis on modular stacks and network-of-networks money movement.
- AI, stablecoins, and agentic commerce evolve from important innovation areas to central, cross-cutting enablers, with value-added services reframed as core growth engines rather than adjuncts.
Theme drift or shifts in emphasis
- Strategic language shifts from “new flows” and open banking toward “money movement” and network-of-networks, broadening the ambition beyond card and even beyond Visa-branded transactions.
- Regulatory and open banking are reframed from potential threats to manageable complexities and, increasingly, to opportunities within a broader platform vision.
Capital allocation signal evolution
- Capital return remains consistently framed as deployment of “excess” cash, but management becomes more explicit that elevated investment in AI, infrastructure, and value-added services will be maintained even when it pressures near-term leverage.
- M&A messaging shifts from specific named deals and regional capabilities toward a more general, capability-driven lens, with greater openness to using uncertainty to acquire strategic assets.
Risk narrative evolution
- Macro, FX, and regulatory risks are consistently acknowledged, but the framing moves from cautious monitoring toward treating them as background volatility within a resilient, diversified model.
- Cross-border, incentives, and regulatory risks around new technologies (stablecoins, agentic commerce) are increasingly discussed as manageable execution variables rather than existential threats, with more emphasis on quarter-to-quarter noise than structural concern.
Leverage position & capital efficiency
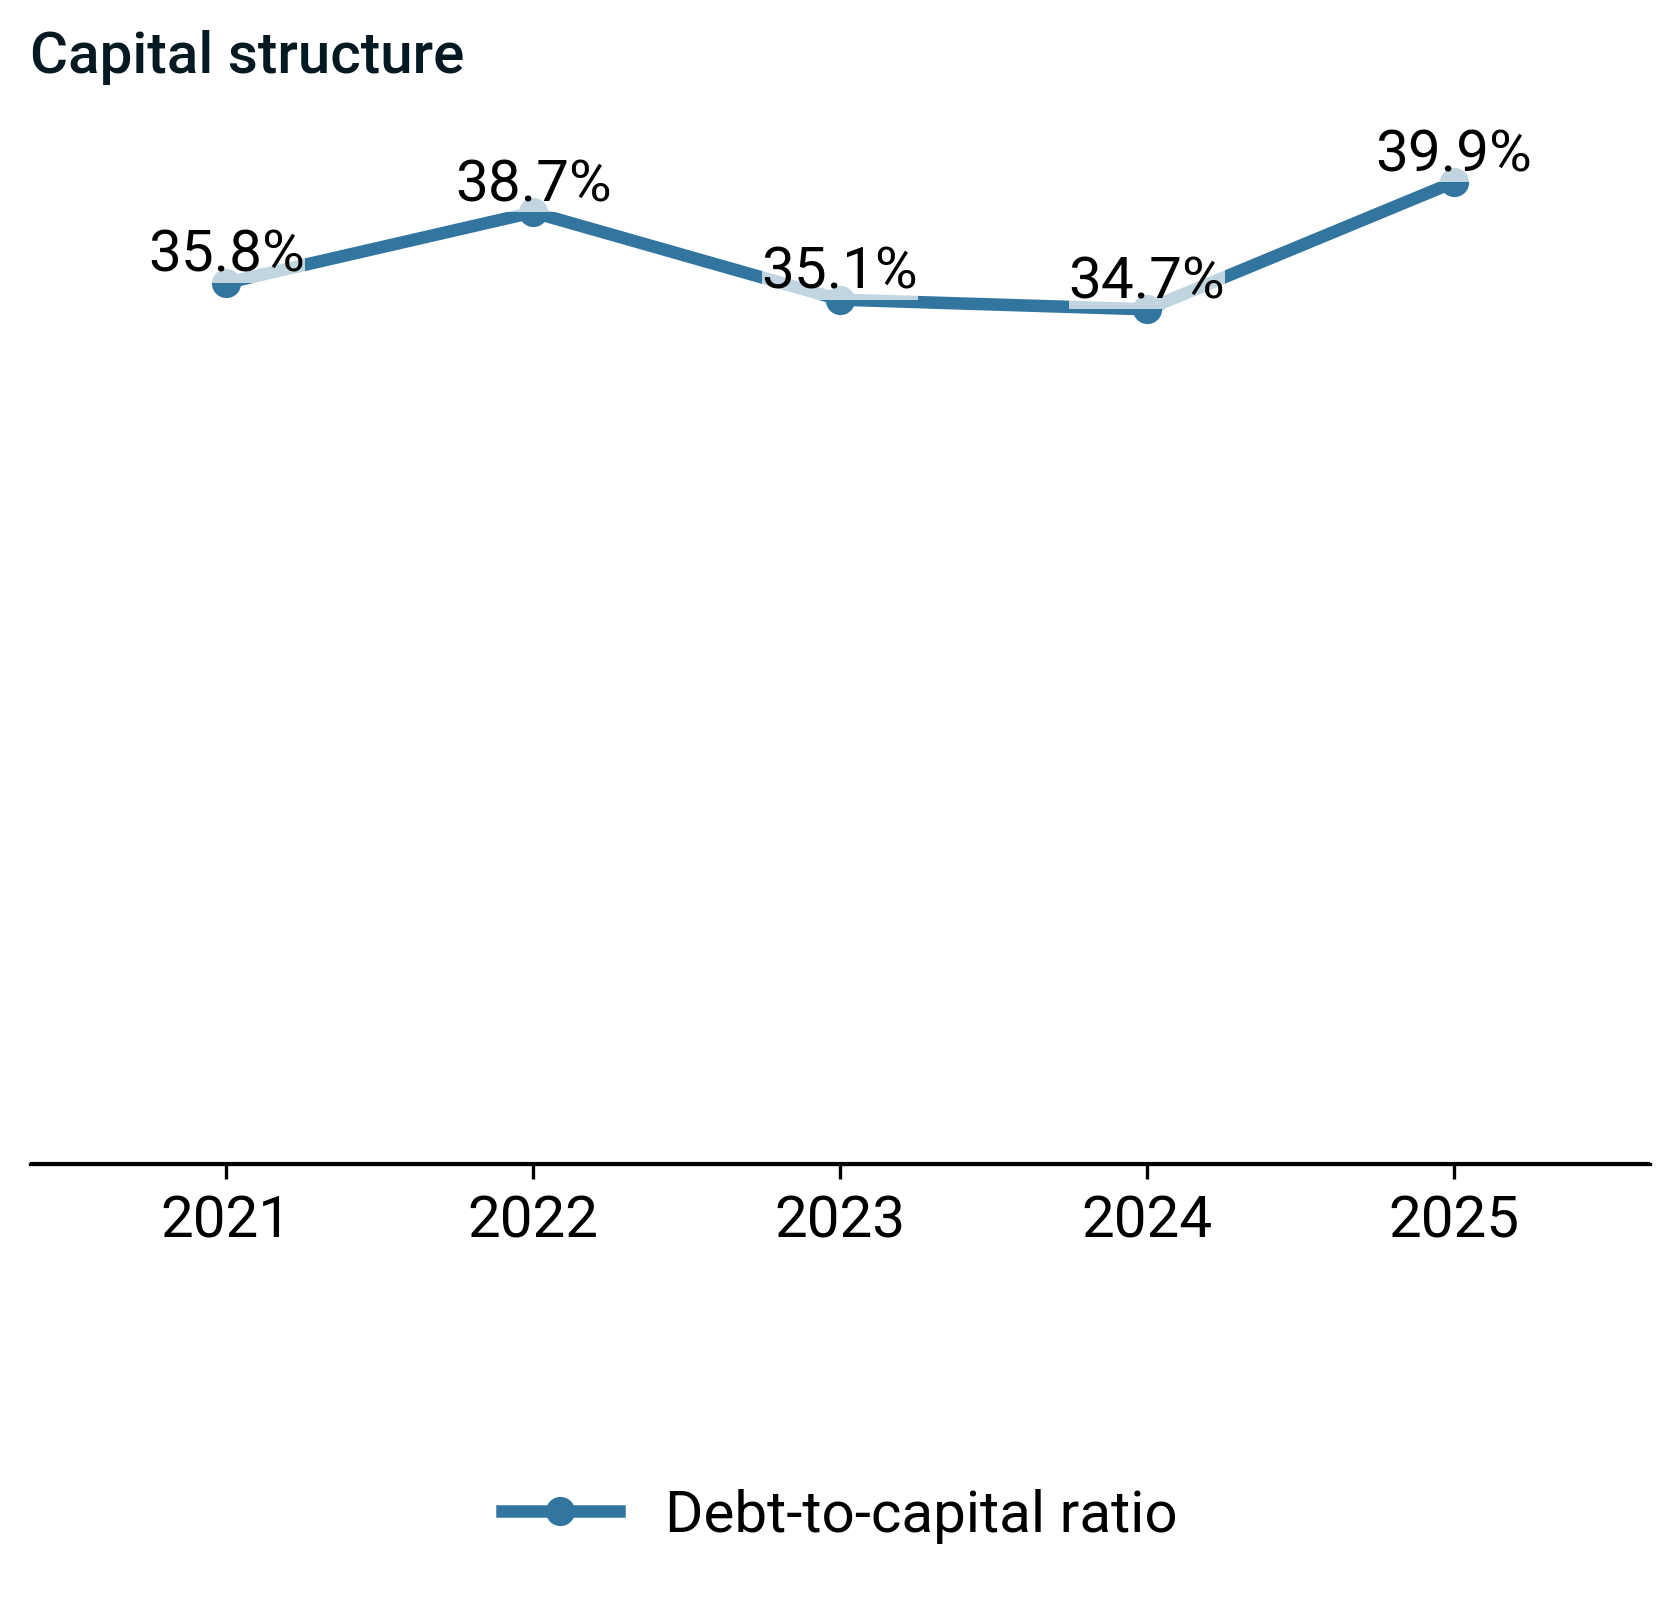
- The debt-to-capital ratio increased, driven primarily by higher debt and lower equity, and now sits above historical leverage norms indicated by debt-to-assets.

- ROIC in 2025 declined 0.2 pp to 28.4%, while ROE increased 2.5 pp to 52.9% versus 2024.
Management on capital structure
- Liquidity remained strong as cash, government securities, undrawn commercial paper and revolving credit facilities, and euro senior notes collectively provided ample term funding and backup capacity, supporting settlement flows that generally did not structurally fund working capital.
- Capital structure and financial flexibility were shaped by euro senior notes and related swaps used as net investment hedges for Visa Europe, litigation escrow arrangements, and retrospective responsibility plans that ring‑fenced certain U.S. and Europe legal exposures.
Cash flow and capital allocation
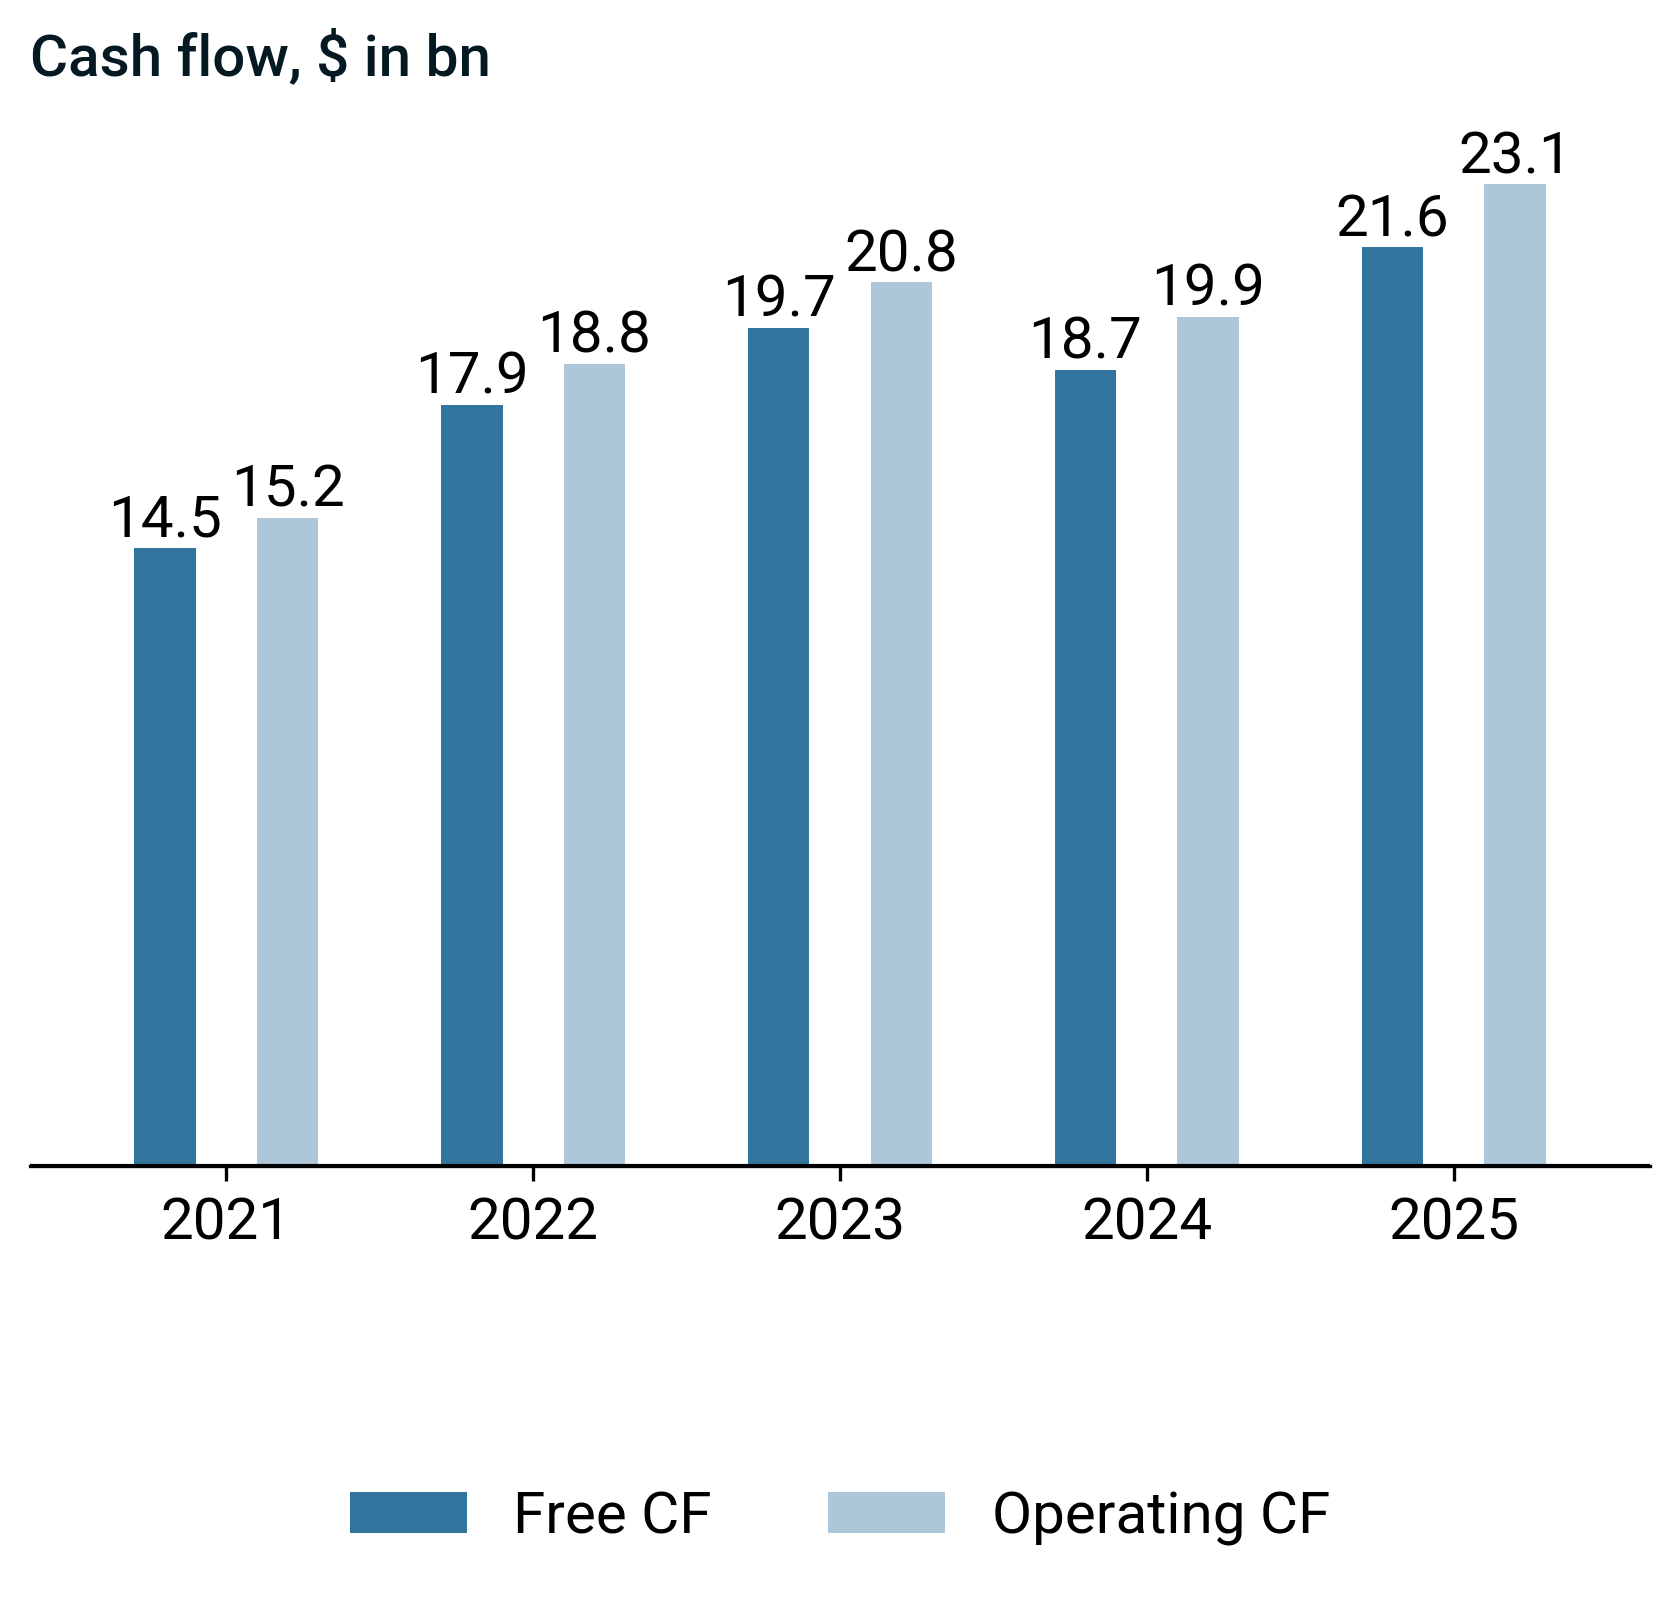
- Free cash flow of $21.6 bn rose, driven primarily by stronger operating cash flow of $23.1 bn despite higher capex of $1.5 bn.
- Investing cash flow shifted to $0.7 bn, and financing cash flow of $-19.0 bn eased outflows, supported by balanced operating and investing flows.
- Income quality of 1.1 increased, indicating closer alignment between earnings and cash flow.

- Capex increased to $1.5 bn while acquisitions were stable at $0.9 bn and R&D remained at $0.0 bn.
- These uses were funded primarily through operating cash flow.
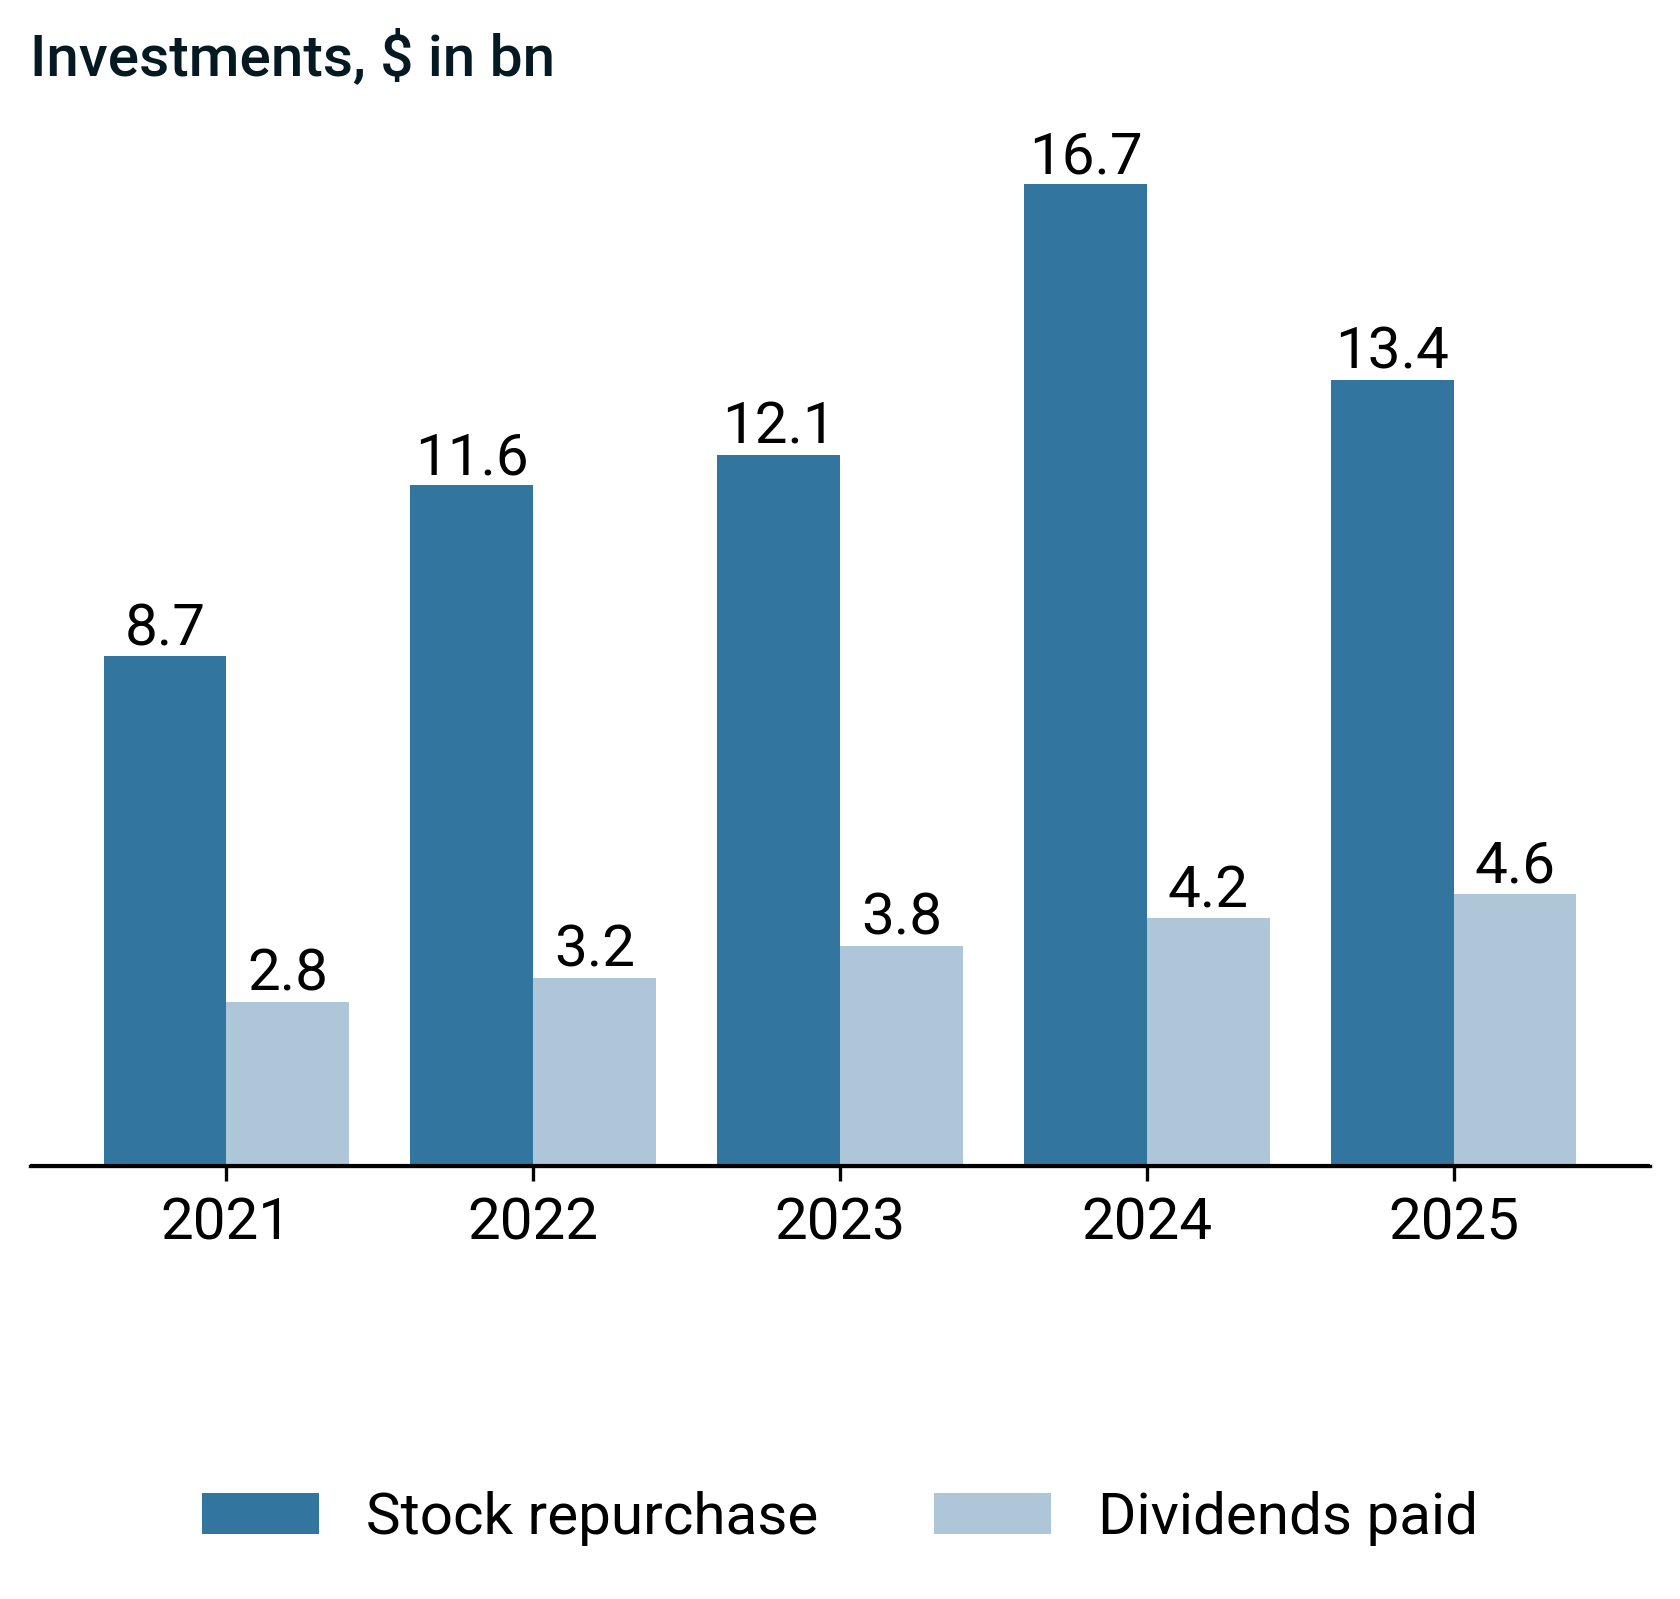
- Capital returns shifted toward dividends as $13.4 bn buybacks eased and $4.6 bn dividends rose, supported by stronger free cf and higher $25.2 bn debt.
Management on capital allocation
- Operating cash flow increased with underlying business growth and favorable timing of income tax payments, but higher client incentive payments and litigation provisions reduced net inflows and constrained margin conversion.
- Management allocated capital primarily to ongoing technology and processing network capex, large flexible share repurchases, regular dividends, targeted acquisitions in fraud and financial crime technology, and funding of restricted litigation escrow to manage legal exposures.
Valuation (2025-09-30)

EPS increased while the stock price declined, indicating improving earnings performance alongside weaker share price momentum.

- EV to EBITDA expanded year over year and sits above its historical norm, driven primarily by higher enterprise value.
- EV to FCF widened modestly and remains above its historical norm, reflecting balanced changes in valuation and fundamentals.
Disclaimer
This presentation is for informational and educational purposes only and does not constitute investment advice, an offer, or a solicitation to buy or sell any security or financial product. The content herein is based on publicly available information, believed to be accurate and reliable at the time of publication, but no representation or warranty, express or implied, is made as to its accuracy, completeness, or correctness.
Any opinions, projections, or forward-looking statements expressed in this material reflect our judgment as of the date of publication and are subject to change without notice. Past performance is not indicative of future results. Investing involves risks, including the potential loss of principal.
The recipient is solely responsible for their own investment decisions and should seek independent financial, legal, and tax advice where appropriate. We disclaim any liability for any direct or consequential loss arising from any use of this presentation or its contents.