NVIDIA Corporation (NVDA): AI infrastructure scale driving margins and cash generation

NVIDIA Corporation (NVDA): FY2025 FY analysis of earnings as of 2025-10-26
Source: company filings.
Access the complete report in PDF presentation format, with detailed charts and long-term value investing insights:
Download the full PDF presentation
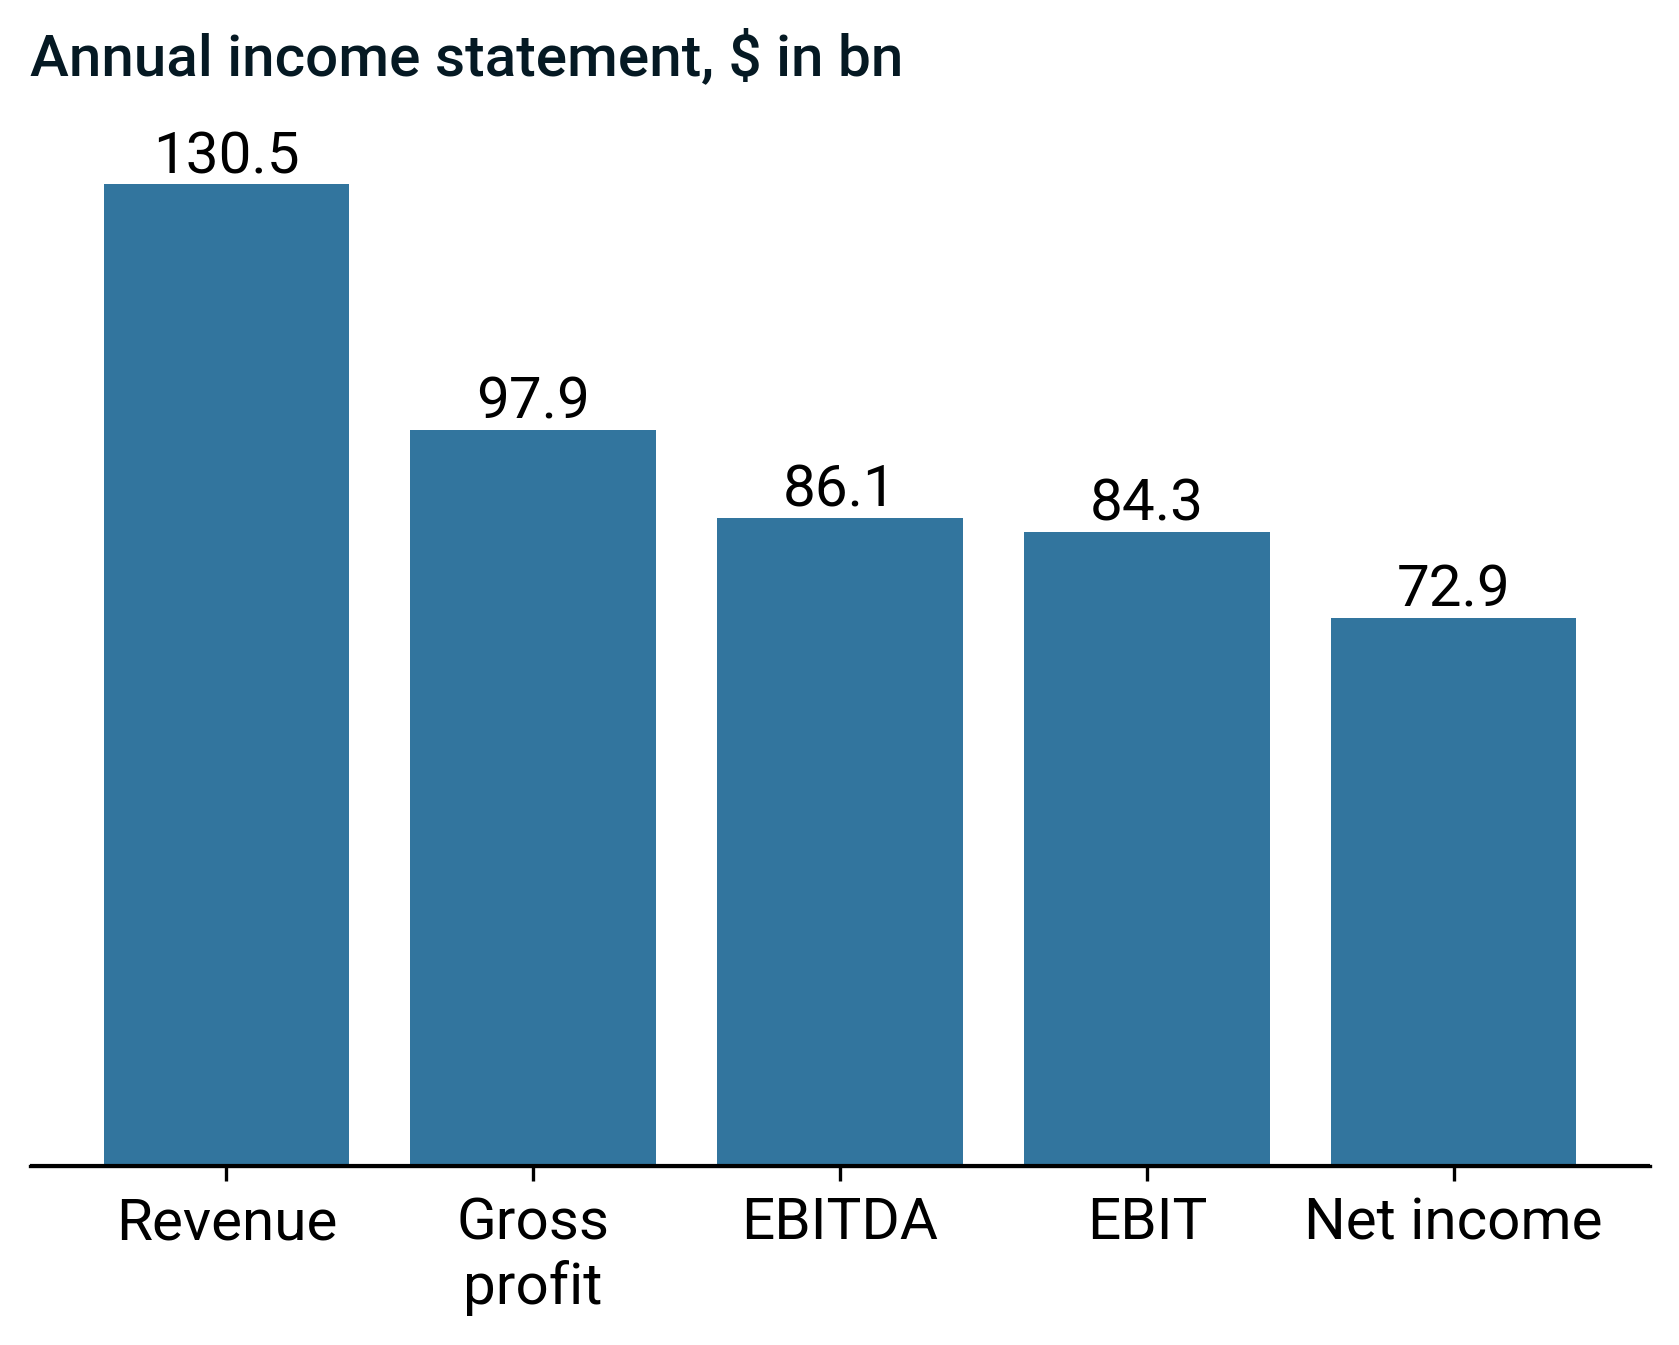
Headline figures 2025, $ in bn
Business description
Corporate Profile:
- NVIDIA Corporation is a U.S.-based semiconductor company incorporated in 1993 and headquartered in Santa Clara, California.
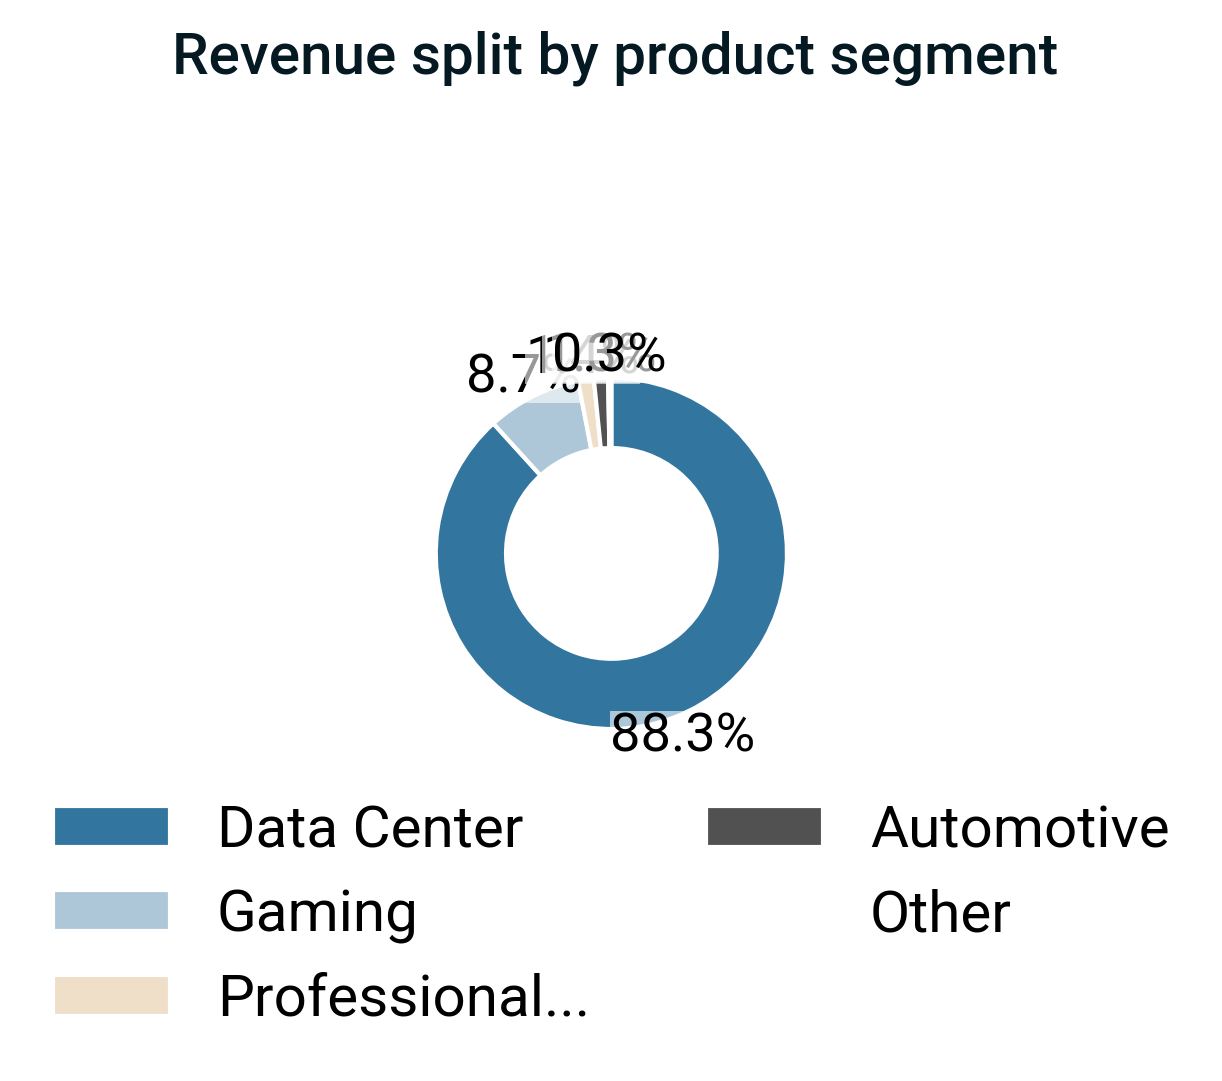
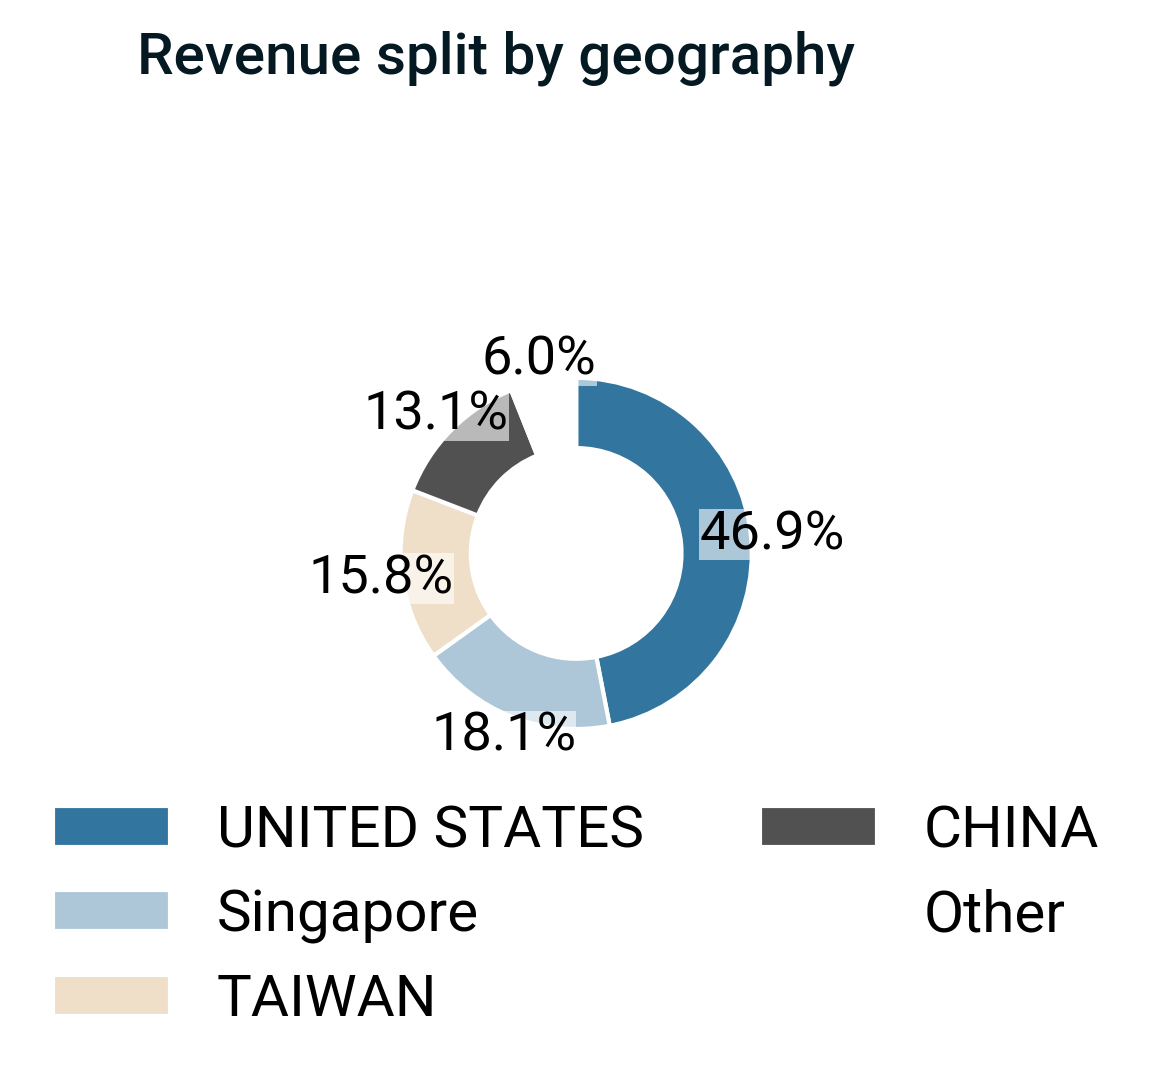
- The company operates globally, providing graphics, compute, and networking solutions in the United States, Taiwan, China, and internationally.
- It serves gaming, professional visualization, data center, and automotive end markets through multiple hardware, software, and services offerings.
Graphics Segment:
- The Graphics segment offers GeForce GPUs for gaming and PCs, related gaming platform solutions, and the GeForce NOW game streaming service and infrastructure.
- It provides Quadro/NVIDIA RTX GPUs for enterprise workstation graphics and vGPU software for cloud-based visual and virtual computing.
- It offers Omniverse software for building 3D designs and virtual worlds and automotive platforms for infotainment systems.
Compute & Networking Segment:
- The Compute & Networking segment provides data center platforms and systems for AI, high-performance computing, and accelerated computing.
- It includes Mellanox networking and interconnect solutions, Jetson for robotics and embedded platforms, and cryptocurrency mining processors.
- It offers NVIDIA AI Enterprise and other software, as well as automotive AI cockpit, autonomous driving development agreements, and autonomous vehicle solutions.
Revenue Model and Delivery:
- The company generates revenue by selling integrated compute, networking, and graphics hardware, licensing proprietary software platforms, and delivering cloud-based AI and gaming services.
- It sells products to OEMs, ODMs, system builders, add-in board manufacturers, retailers and distributors, independent software vendors, internet and cloud service providers, automotive manufacturers and tier-1 suppliers, mapping companies, start-ups, and other ecosystem participants.
Financial performance
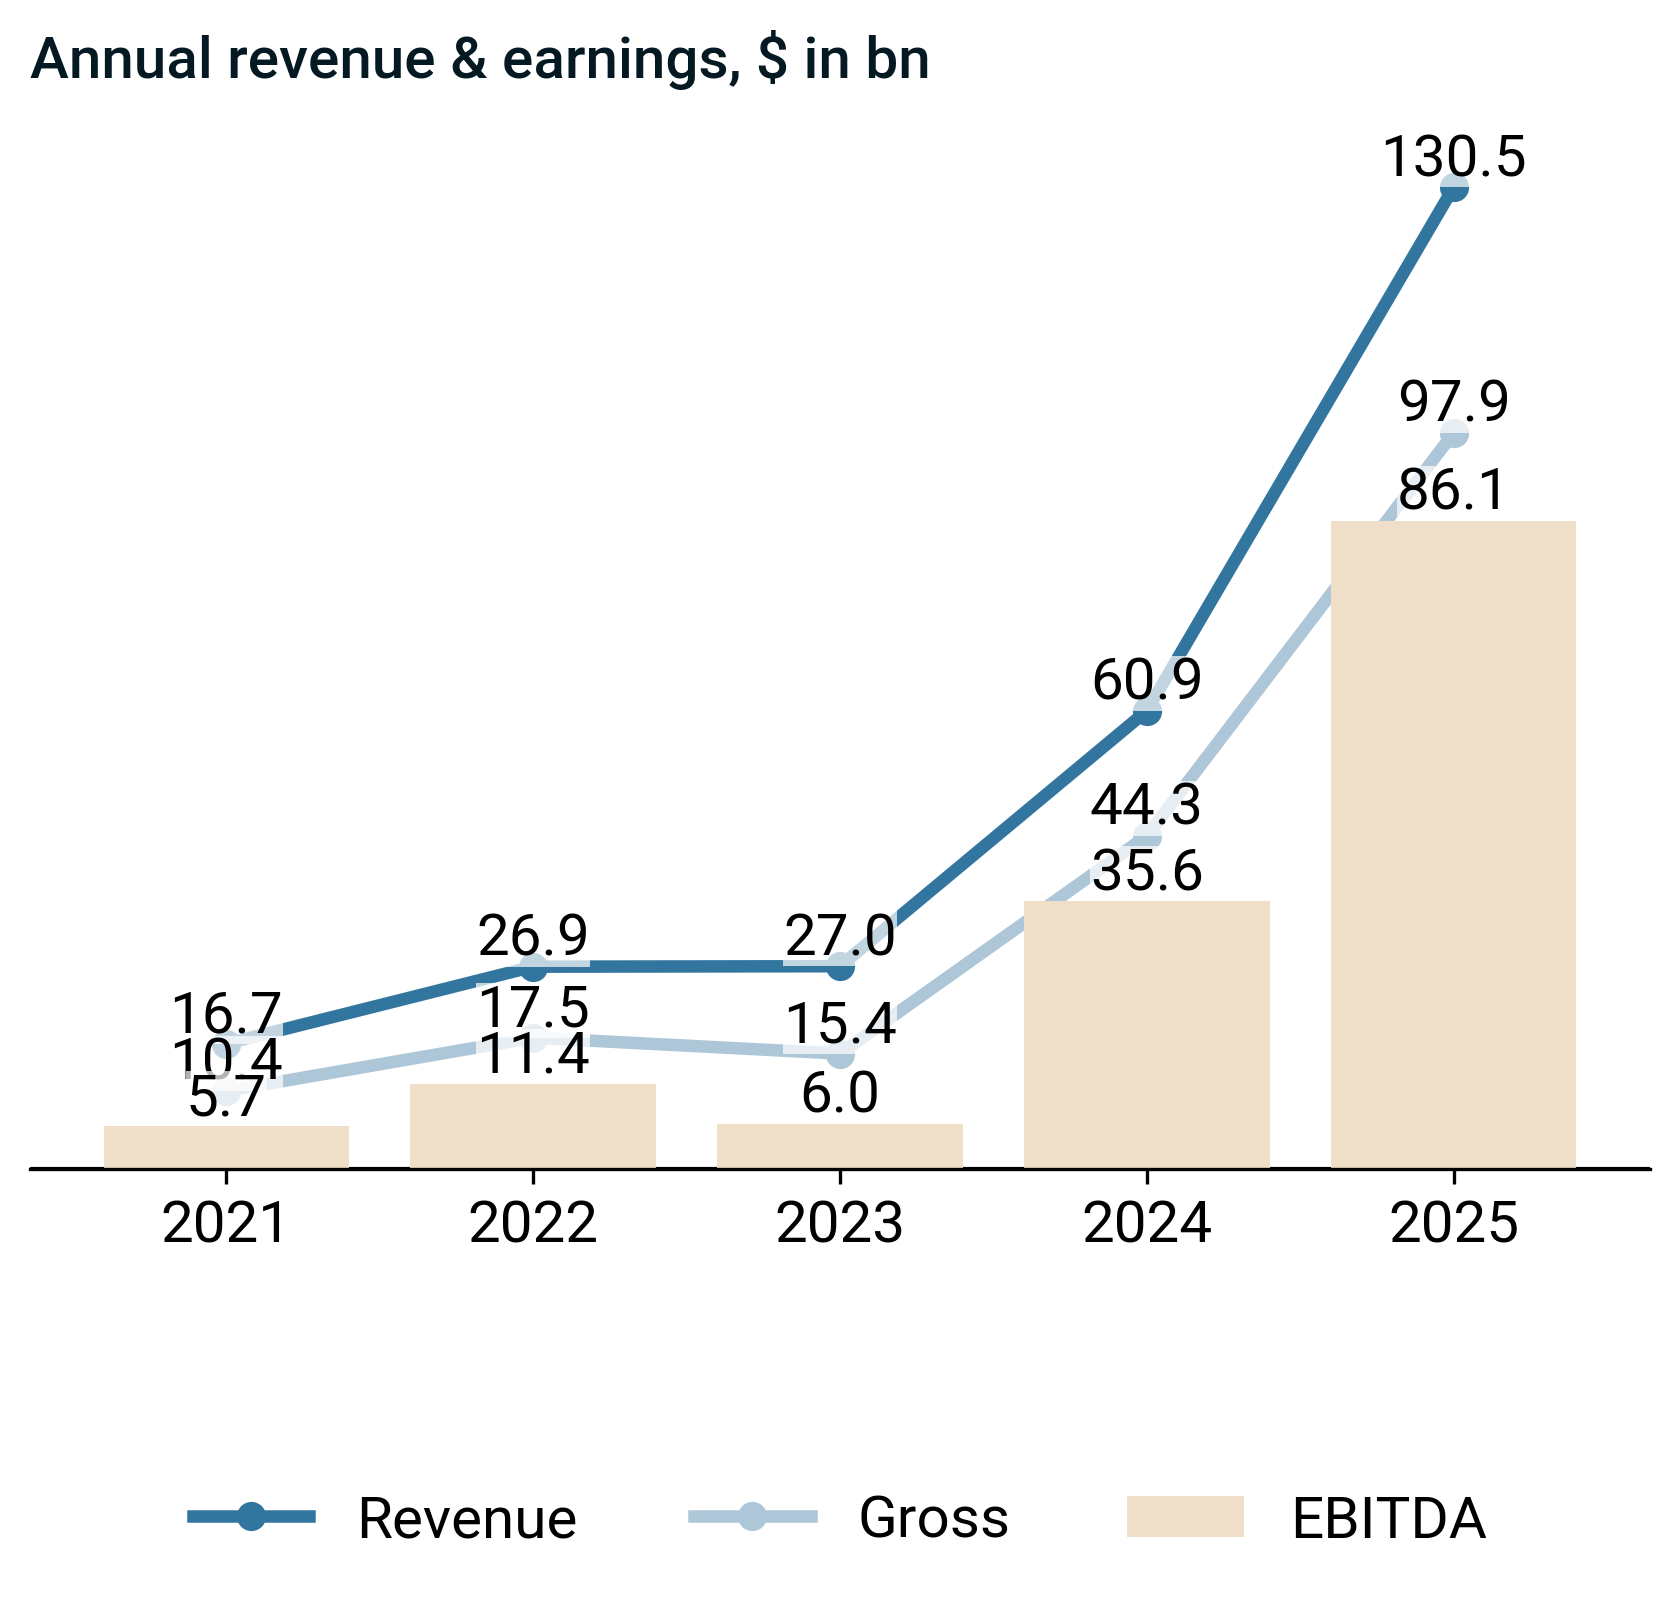
- Revenue rose to $130.5 bn, up 114.2%, marking a third consecutive year of rapid top-line expansion.
- Gross profit increased to $97.9 bn, up 120.9%, outpacing revenue growth.
- EBITDA climbed to $86.1 bn, up 142.1%, indicating strong incremental operating leverage.

- Gross profit ratio rose 3.1pp to 75.0%, now above historical norms, supported by broadly balanced movements across secondary metrics.
- EBITDA ratio increased 7.6pp to 66.0%, above historical norms, driven mainly by gross margin expansion, with no single secondary driver dominating.
Management on top line and margins
- Adoption of Data Center platforms for AI, generative AI, and HPC by cloud providers, consumer internet companies, enterprises, startups, and public sector customers increased revenue.
- Export controls and regulatory restrictions, particularly affecting advanced AI products and China, constrained revenue growth by forcing product segmentation, redesign, or withdrawal from key markets.
- Full-stack integration, proprietary software, and premium data center platforms supported structurally higher pricing and favorable mix, which expanded gross margin and operating margin.
- Fabless reliance on advanced-node foundries, non‑cancellable commitments, and potential yield or demand misalignments temporarily pressured margins through scrap, write‑downs, and inventory or cancellation charges.
Annual report executive recap
Strategy & operating model
- Management operationalized strategy through a unified, programmable architecture and full-stack innovation model that reused hardware and software across Data Center, Gaming, Professional Visualization, and Automotive, leveraging shared R&D and synchronized processor and platform cadences.
- Management embedded with customers by co-designing and optimizing solutions with CSPs, OEMs, ISVs, and enterprises, and by building long-term developer, startup, university, automotive, and industrial ecosystems around CUDA, SDKs, and simulation and reference platforms.
Supply chain & operational footprint drivers
- The company operated a fabless model that outsourced wafer fabrication to foundries such as TSMC and Samsung and outsourced assembly, testing, and packaging to partners including Hon Hai, Wistron, and Fabrinet, which concentrated manufacturing dependencies in a limited set of advanced-node suppliers.
- The company directly procured key components such as memory and substrates while relying on suppliers for most raw materials, and it concentrated its supply chain in Asia-Pacific, which increased exposure to regional disruptions and export controls.
- The company expanded supplier relationships, placed non-cancellable orders, and sometimes paid premiums or deposits to secure capacity, which built redundancy and resilience but increased inventory levels, working capital requirements, and cash flow volatility.
Transactions, portfolio actions & major strategic initiatives
- Acquisition of Mellanox expanded NVIDIA into high-performance networking, enabled data-center-scale platform offerings, and created the DPU processor class to deepen full-stack data center capabilities and strengthen competitive positioning in accelerated computing.
Risk factors & forward-looking signals
- Management highlighted that reliance on a small set of advanced-node foundries, long lead times, and non‑cancellable purchase commitments increased risk of supply decommitments, inventory write‑downs, price cuts, and margin compression if demand or process execution deviated from expectations.
- Management stated that evolving export controls, especially affecting China, and customers’ development of competing AI platforms created uncertainty around sustaining data center demand, premium pricing, and overall top‑line growth.
Earnings call executive recap & narrative evolution
Consistent strategic themes
- Persistent framing of NVIDIA as a full-stack, data-center-scale AI infrastructure and software platform, with annual architectural cadence and “AI factory” concepts at the core.
- Steady emphasis on long-duration, secular AI demand across hyperscalers, sovereigns, enterprises, and physical/robotics use cases, with accelerated computing displacing CPU-centric architectures.
Intensifying or reinforced signals
- Growing conviction that demand is structurally supply-constrained, with increasingly explicit focus on power, land, and foundry capacity as gating factors rather than end-demand risk.
- Reinforced narrative that software, networking, and ecosystem depth (CUDA, partnerships, equity stakes) are as critical as silicon, locking in platform dependence and standard-setting power.
Theme drift or shifts in emphasis
- Shift from early focus on ramping a specific new architecture to a broader narrative of continuous, annual platform transitions spanning training, inference, generative, agentic, and physical AI.
- Evolution from highlighting competitive threats and execution complexity toward a more inevitable, winner-take-most framing with less airtime given to rivals or digestion risk.
Capital allocation signal evolution
- Movement from balancing shareholder returns with heavy reinvestment toward more explicit prioritization of capacity, supply security, and ecosystem investments over buybacks, while still signaling confidence via ongoing repurchases.
- Increasing use of large cash generation as a strategic weapon: long-term supply commitments, onshore manufacturing, and targeted equity stakes in AI leaders framed as core to sustaining advantage.
Risk narrative evolution
- Geopolitical and export-control risk around China remains a constant, but the tone shifts from confrontational and cautionary to more matter-of-fact, with greater focus on adaptation and diversification.
- Execution and margin risks tied to complex, rack-scale systems and rising input costs are increasingly reframed as manageable engineering and planning challenges rather than fundamental threats.
Leverage position & capital efficiency

- The debt-to-capital ratio declined sharply in 2025, driven primarily by higher equity and lower short-term debt.

- ROIC rose 24.0 pp to 75.3% in 2025, above its recent history, driven primarily by higher EBIT.
- ROE increased 22.6 pp to 91.9%, supported by strong net income growth.
Management on capital structure
- Non‑cancellable component orders, premiums, and deposits to secure capacity increased inventory and prepayments, which tied up working capital and reduced near‑term financial flexibility during growth periods.
- Fabless manufacturing and limited direct capex for fabrication facilities kept capital intensity and on‑balance‑sheet fixed assets relatively low, which supported balance‑sheet flexibility and constrained leverage despite substantial data‑center‑scale infrastructure investments.
Cash flow and capital allocation
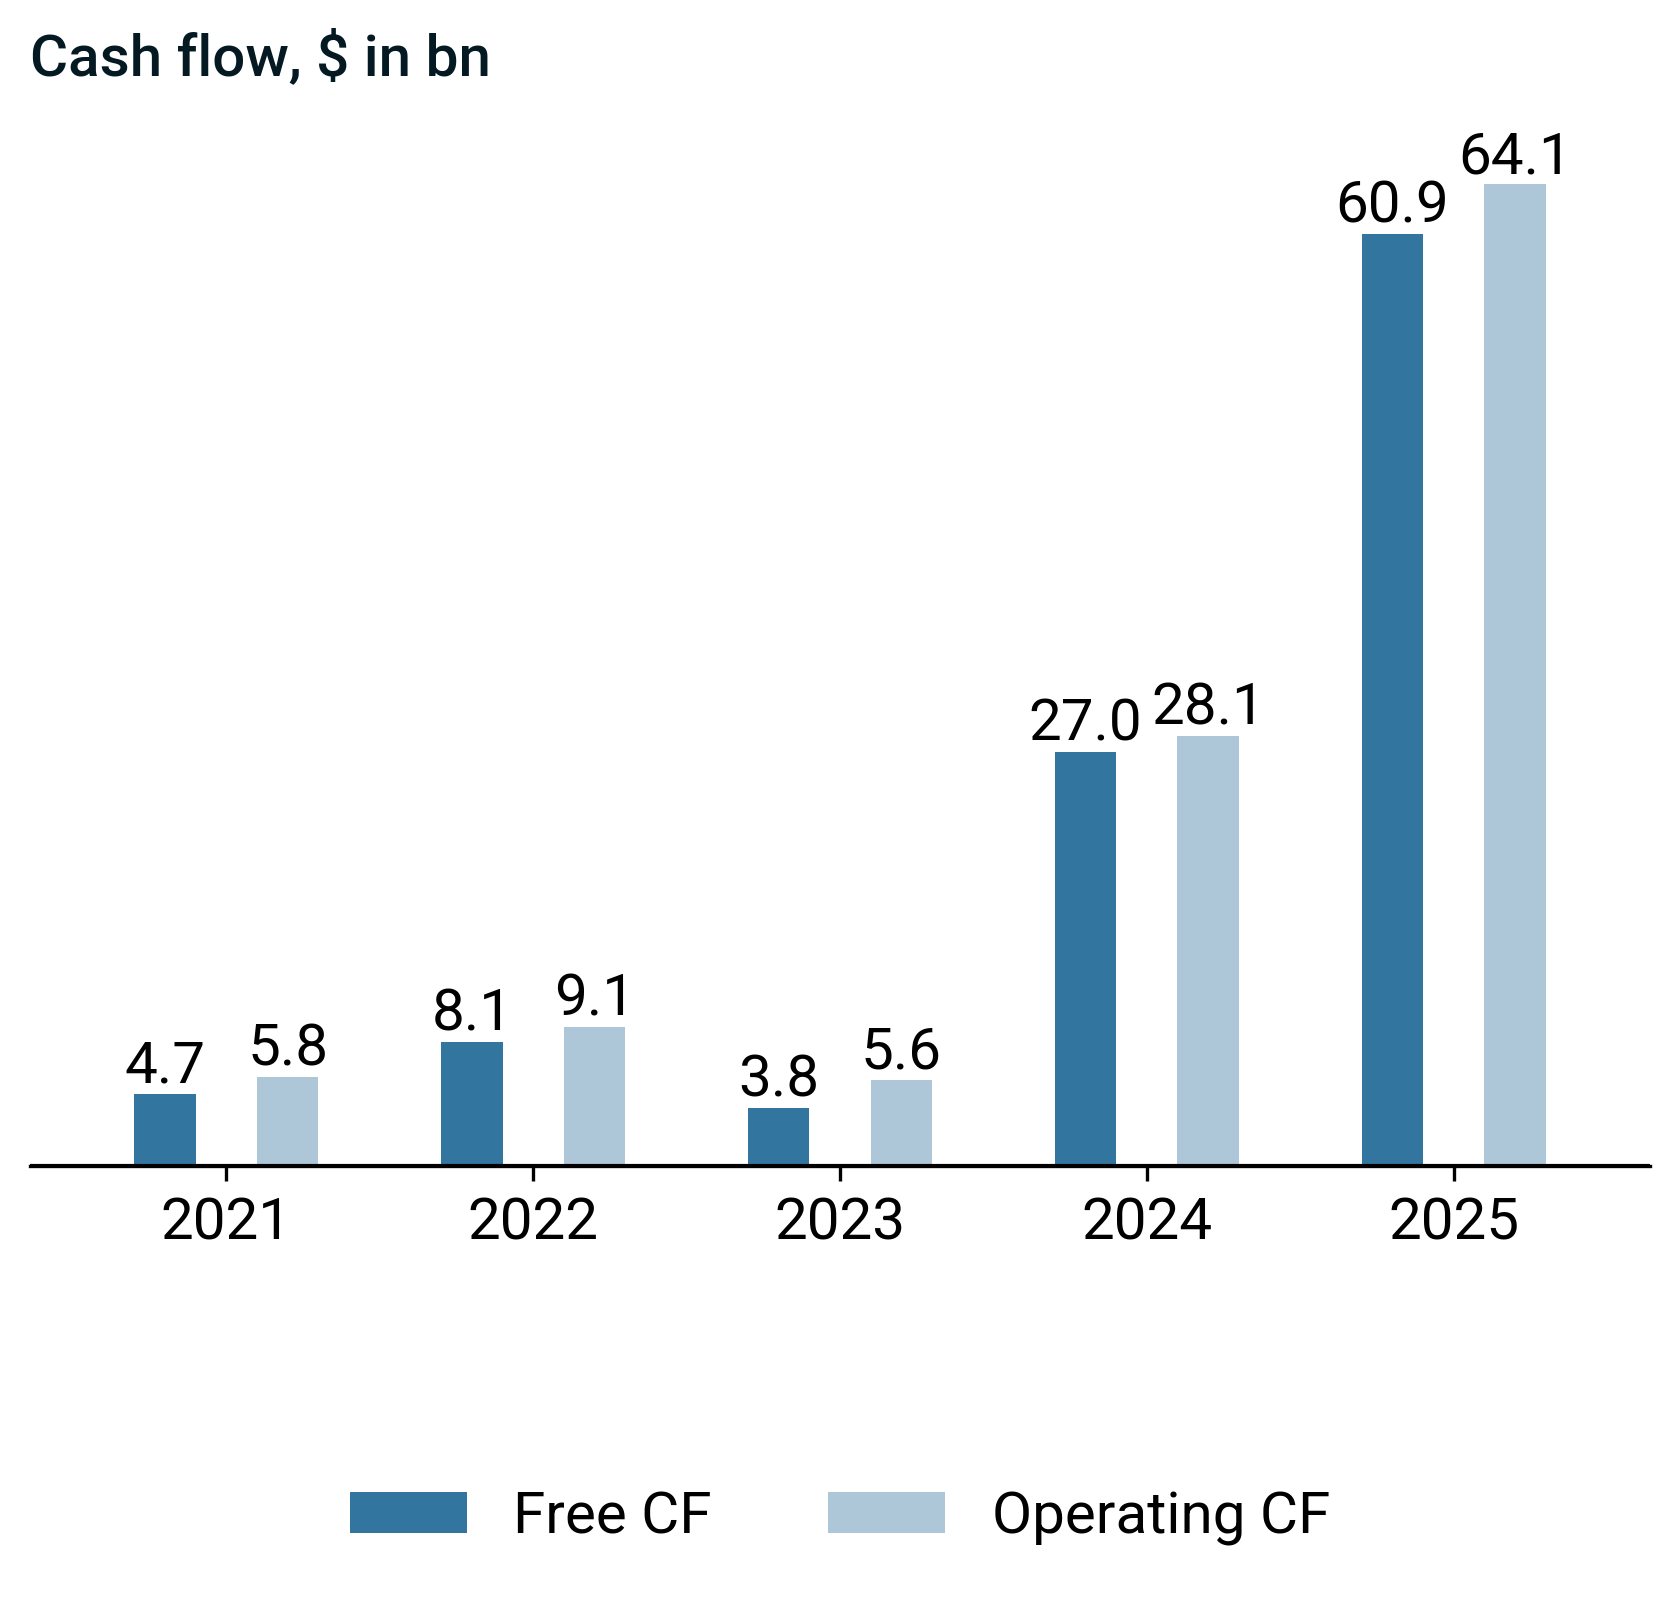
- Free cash flow of $60.9 bn rose sharply, driven primarily by stronger operating cash flow of $64.1 bn despite higher capex of $3.2 bn.
- Investing cash flow outflows intensified to $-20.4 bn and financing cash flow outflows accelerated to $-42.4 bn, supported by balanced operating and investing flows.
- Income quality at 0.9 was stable year over year, indicating closer alignment between earnings and cash flow.

- Acquisitions rose to $1.0 bn, while capex increased to $3.2 bn and R&D to $12.9 bn, funded primarily through $64.1 bn operating cash flow.

- Stock repurchase rose to $33.7 bn in 2025, reflecting share repurchases funded by stronger $64.1 bn operating cf and $60.9 bn free cf.
Management on capital allocation
- Non‑cancellable component orders, premiums, and deposits to secure Asia‑Pacific supply capacity increased inventory and prepayments, which tied up working capital and constrained operating cash flow during growth periods.
- The fabless model limited manufacturing capex and directed capital allocation toward R&D, software, data‑center reference systems, and cloud services infrastructure, as management prioritized high‑return reinvestment and IP licensing/custom development agreements over more capital‑intensive ownership.
Valuation (2025-01-26)

EPS increased while the stock price declined, indicating improving earnings performance alongside weaker share price momentum.

- EV to EBITDA contracted year over year and now sits below its historical norm.
- EV to FCF also narrowed and is below its historical norm.
- Changes reflect balanced shifts in valuation and fundamentals.
Disclaimer
This presentation is for informational and educational purposes only and does not constitute investment advice, an offer, or a solicitation to buy or sell any security or financial product. The content herein is based on publicly available information, believed to be accurate and reliable at the time of publication, but no representation or warranty, express or implied, is made as to its accuracy, completeness, or correctness.
Any opinions, projections, or forward-looking statements expressed in this material reflect our judgment as of the date of publication and are subject to change without notice. Past performance is not indicative of future results. Investing involves risks, including the potential loss of principal.
The recipient is solely responsible for their own investment decisions and should seek independent financial, legal, and tax advice where appropriate. We disclaim any liability for any direct or consequential loss arising from any use of this presentation or its contents.