Costco Wholesale Corporation (COST): Warehouse scale expansion with steady cash conversion

Costco Wholesale Corporation (COST): FY2025 FY analysis of earnings as of 2025-11-23
Source: company filings.
Access the complete report in PDF presentation format, with detailed charts and long-term value investing insights:
Download the full PDF presentation
Headline figures 2025, $ in bn
Business description
Membership Warehouse Operations:
- Operates membership warehouses that sell a broad range of branded and private-label merchandise to members.
- Runs 815 membership warehouses across the United States, Puerto Rico, Canada, Mexico, the United Kingdom, Japan, South Korea, Taiwan, Australia, Spain, Iceland, France, and China as of August 29, 2021.
- Generates revenue from membership-based access to warehouse shopping and related services.
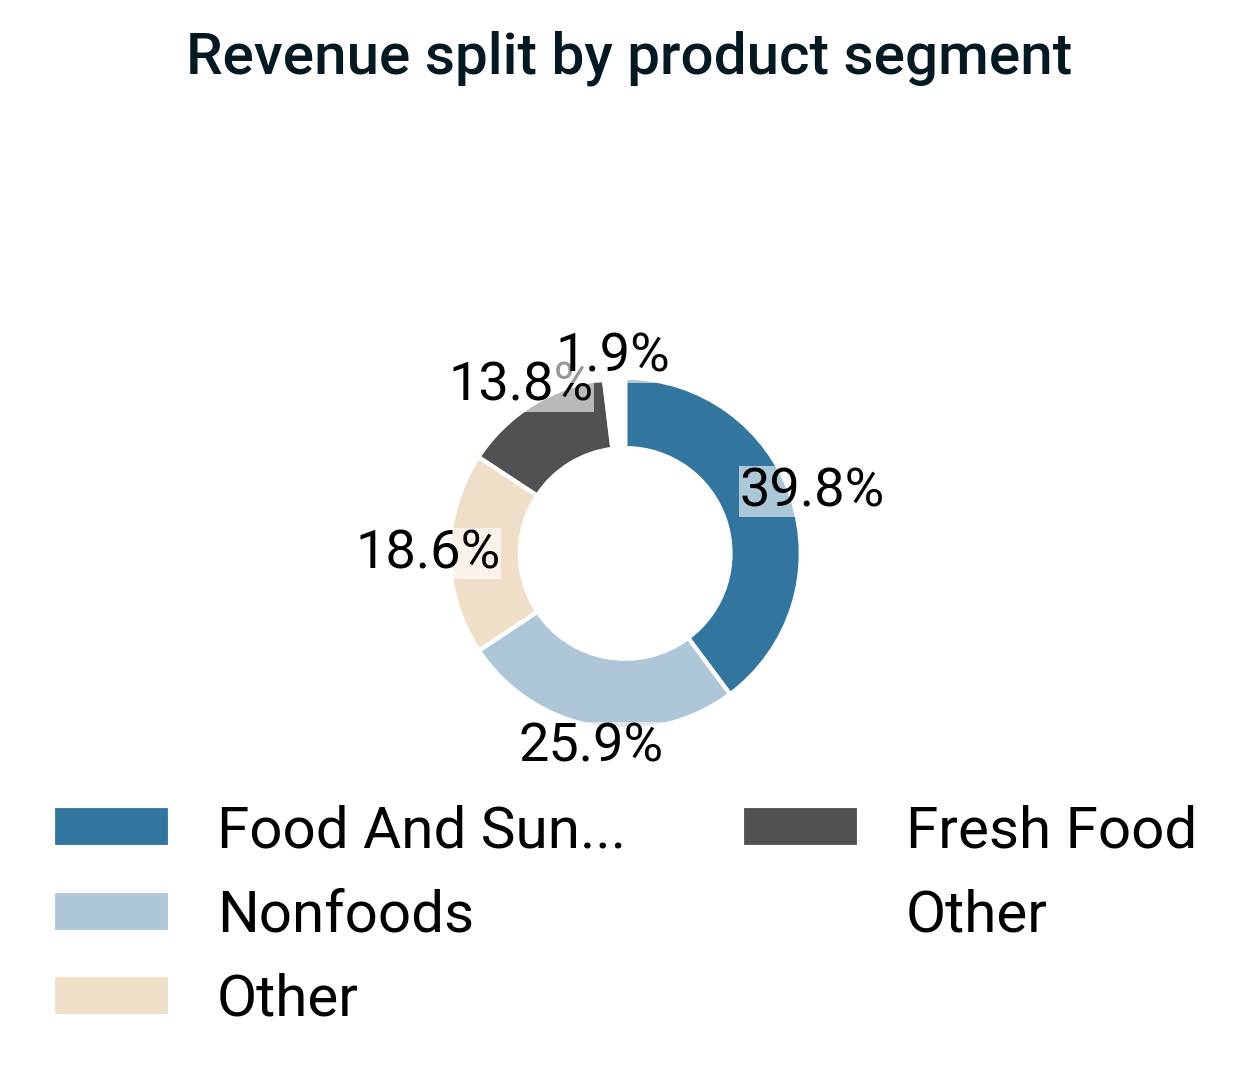
Merchandise Categories:
- Offers sundries, dry groceries, candies, coolers, freezers, liquor, tobacco, and deli products.
- Sells appliances, electronics, health and beauty aids, hardware, garden and patio products, sporting goods, tires, toys, seasonal products, office supplies, automotive care products, postages, tickets, apparel, small appliances, furniture, domestics, housewares, special order kiosks, and jewelry.
- Provides meat, produce, service deli, and bakery products within warehouse locations.
Ancillary In-Store Services:
- Operates pharmacies, optical departments, food courts, hearing-aid centers, and tire installation centers within or adjacent to warehouses.
- Operates 636 gas stations associated with its warehouse locations.
E-Commerce and Online Services:
- Operates e-commerce websites in the United States, Canada, the United Kingdom, Mexico, South Korea, Taiwan, Japan, and Australia.
- Offers business delivery, travel, same-day grocery, and various other services online in multiple countries.
Corporate Structure and History:
- Operates as Costco Wholesale Corporation, formerly known as Costco Companies, Inc. until a name change in August 1999.
- Functions as a U.S.-based corporation founded in 1976 and headquartered in Issaquah, Washington, with operations conducted together with its subsidiaries.
Financial performance
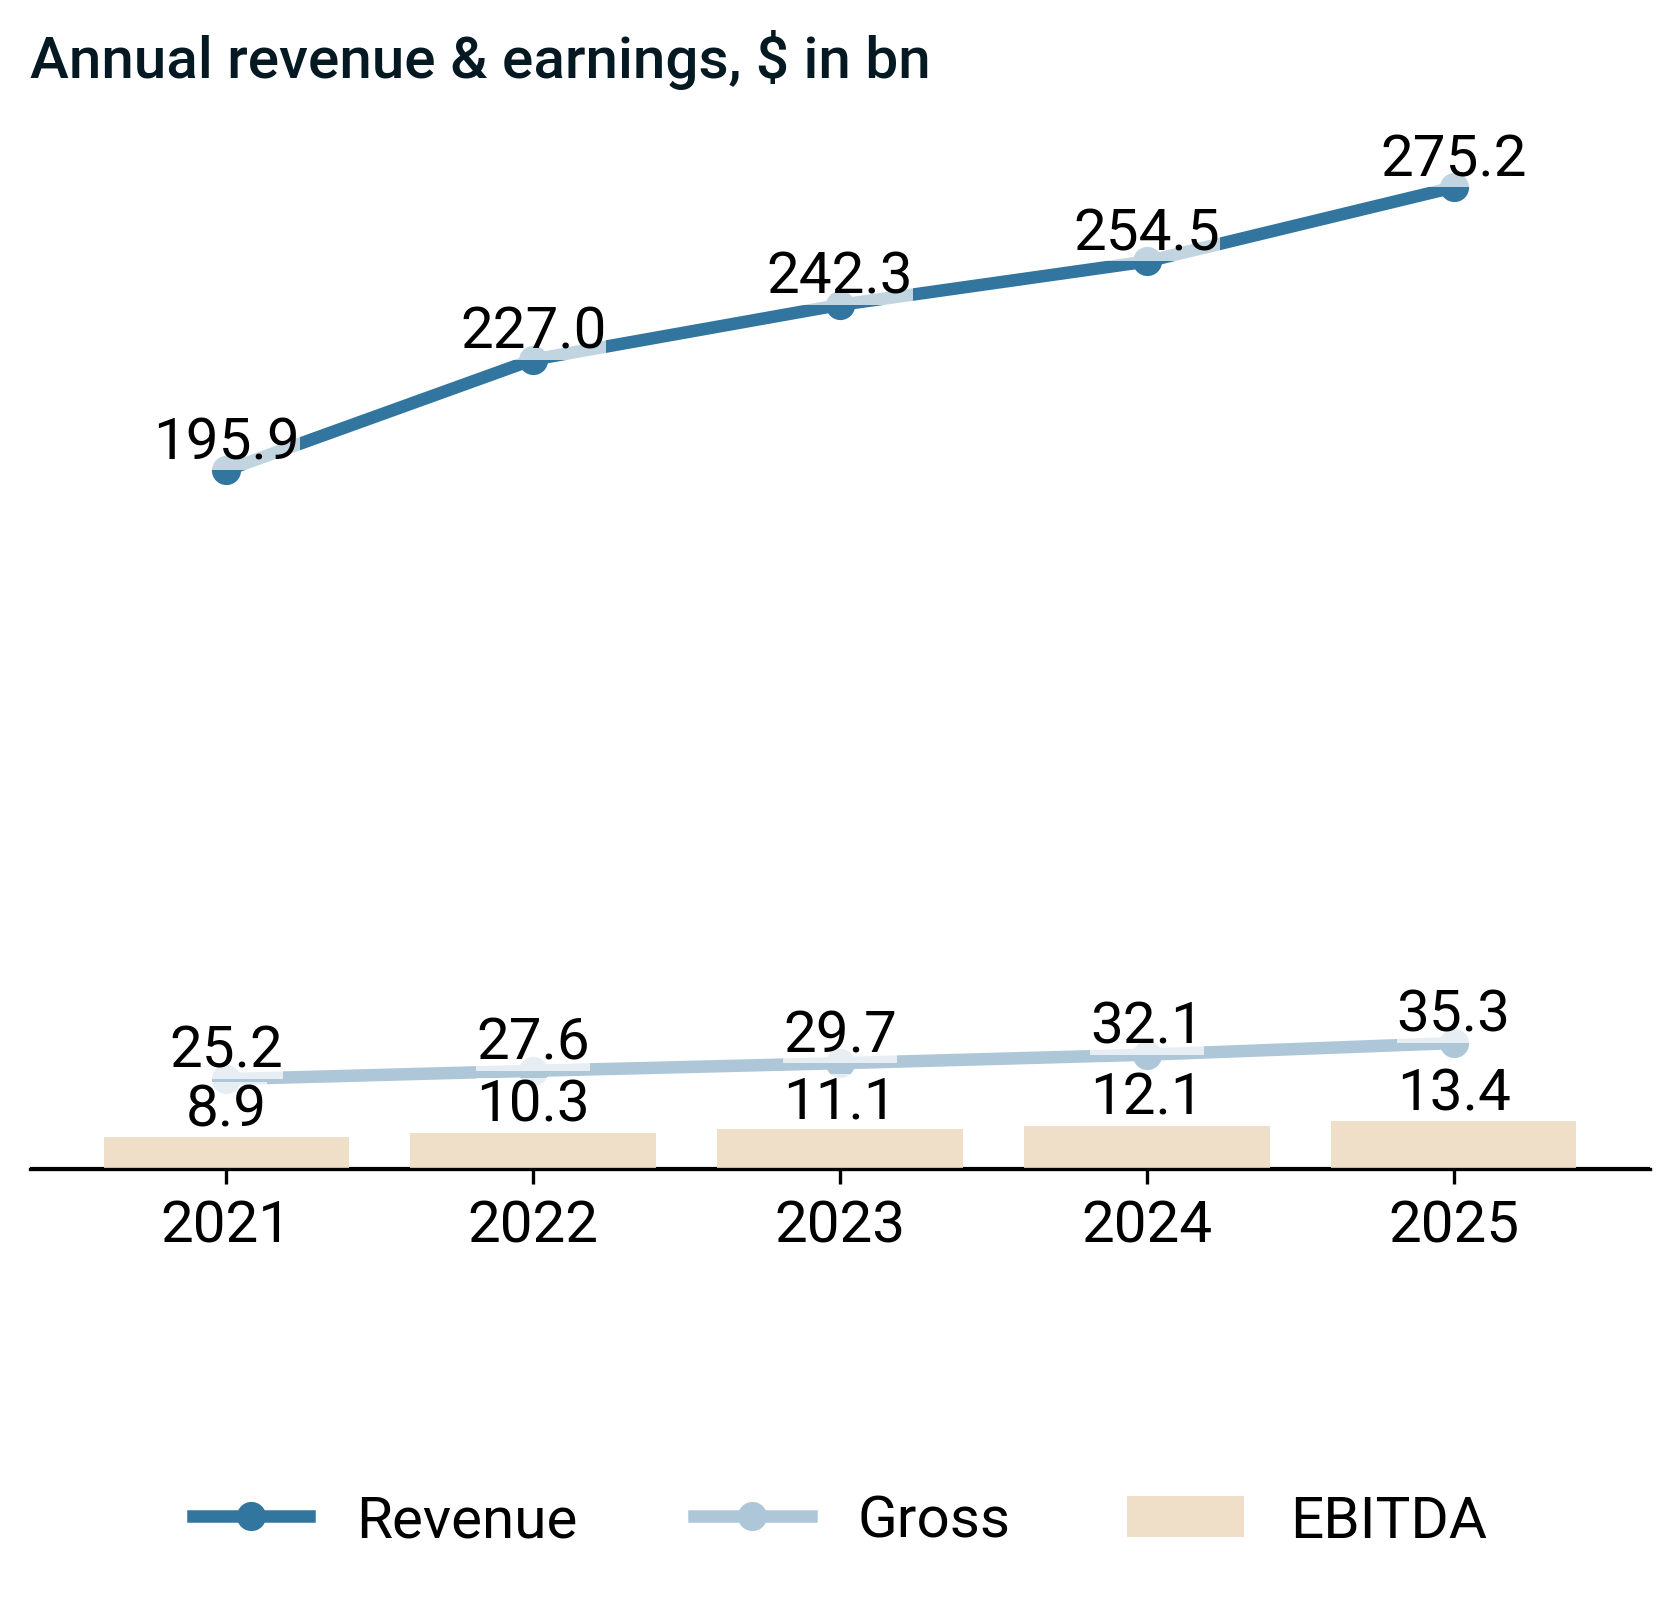
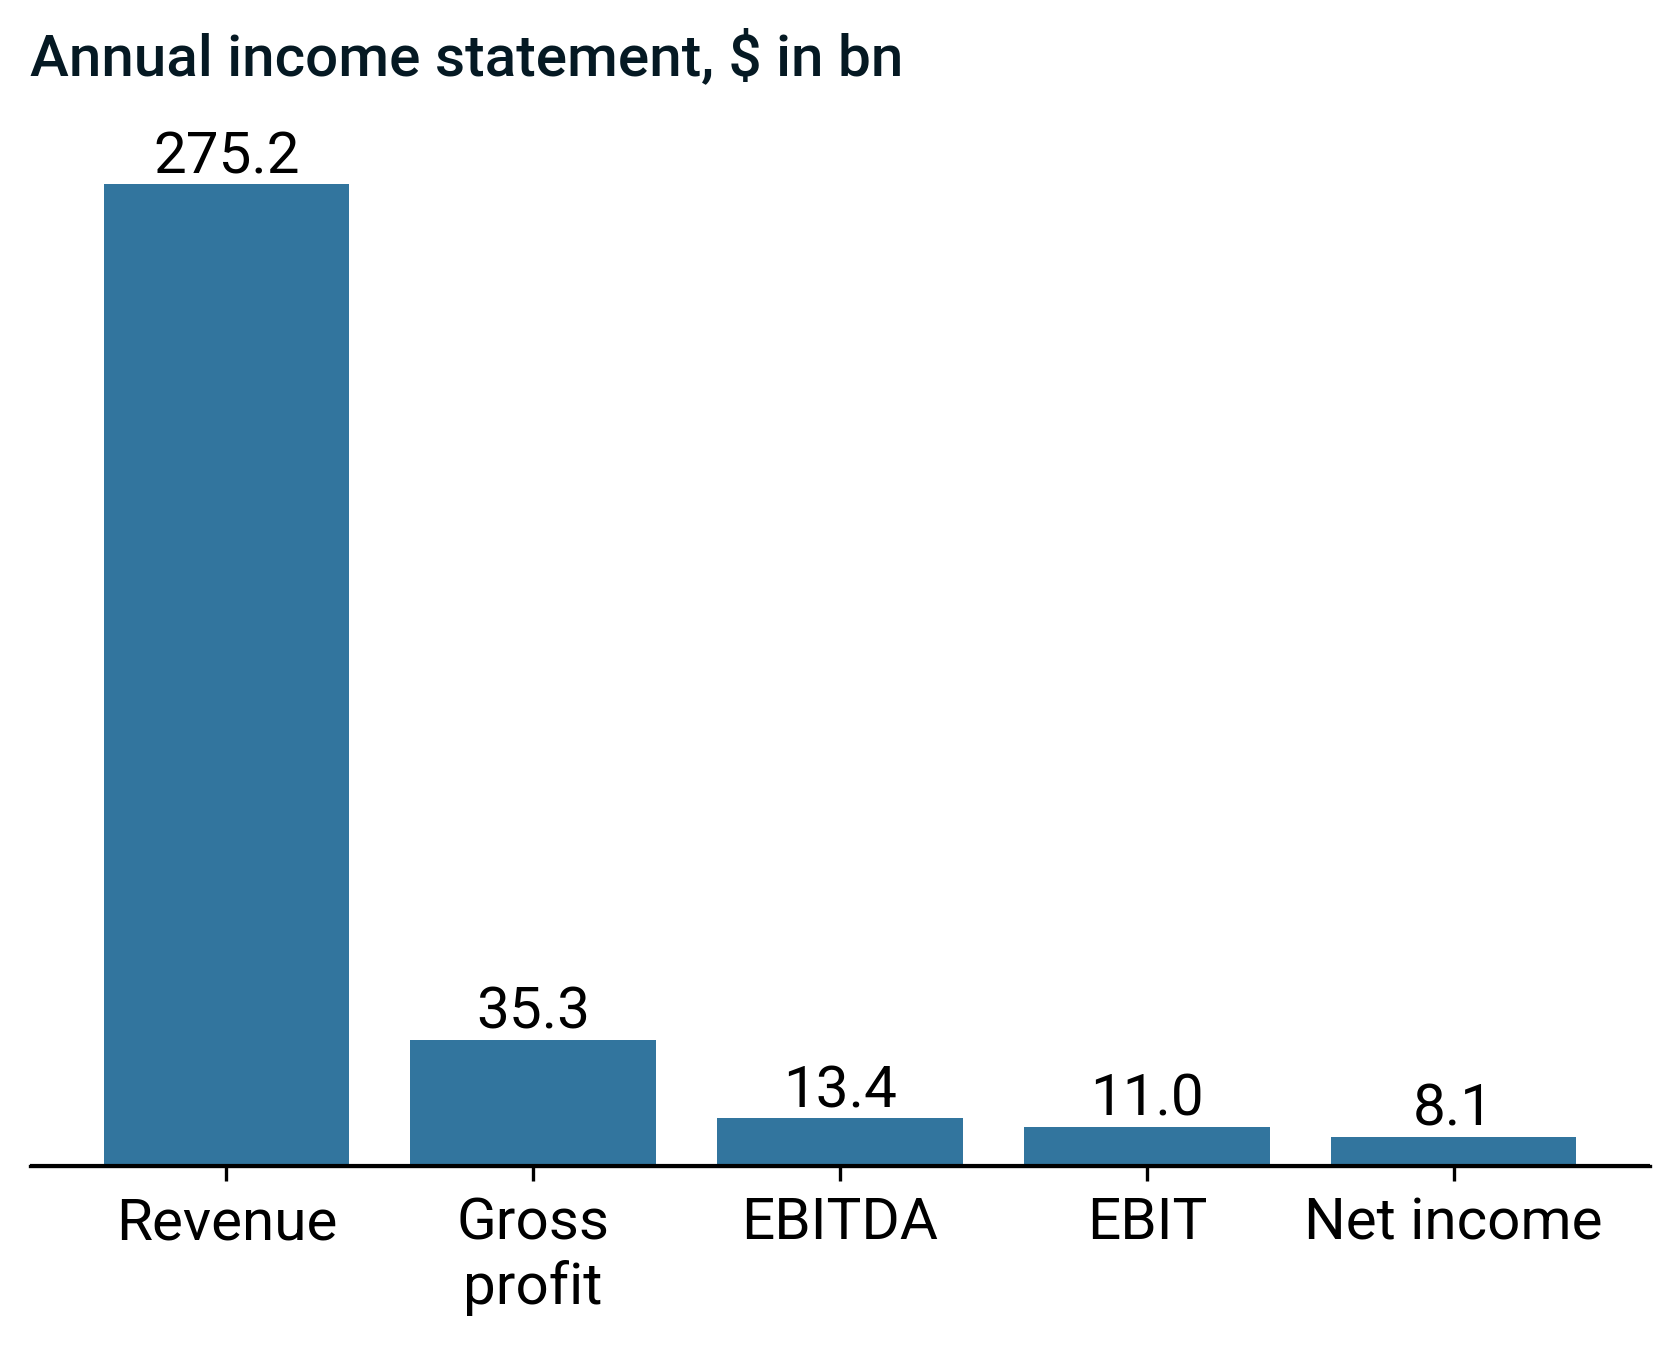
- Revenue rose to $275.2 bn, up $20.8 bn (+8.2%), with gross profit up to $35.3 bn and EBITDA up to $13.4 bn, both growing slightly faster than sales.

- Gross profit ratio rose 0.2pp to 12.8%, now above its historical norm, supported by broadly balanced movements across secondary metrics.
- EBITDA ratio increased 0.1pp to 4.9%, also above its historical norm, with no single secondary driver dominating.
Management on top line and margins
- The company provided no substantive disclosures on revenue or demand drivers in the referenced 10-K sections, which prevented identification of specific factors that increased, reduced, or constrained revenue.
- The company provided no disclosed information on cost structure or margin drivers, which prevented identification of factors affecting gross margin or operating margin.
Annual report executive recap
Strategy & operating model
- Management disclosed no substantive information about how it operationalized strategy, which prevented identification of concrete execution mechanisms.
- Management provided no details on customer embedding or co-design practices, which precluded assessment of operational customer-integration processes.
Risk factors & forward-looking signals
- The company disclosed that the referenced 10-K sections lacked substantive content, which created uncertainty about identifiable risks and their potential impact on future financial results.
Earnings call executive recap & narrative evolution
Consistent strategic themes
- Steady, global warehouse expansion, supported by logistics, depots, and technology, remains the core growth engine, with infill and relocations used to relieve pressure on high-volume locations.
- A member-first, price-leadership model anchored in private label, value “treasure hunt,” and omnichannel convenience is consistently prioritized over short-term margin maximization.
Intensifying or reinforced signals
- Digital, data, and AI are increasingly framed as embedded enablers of the core warehouse model—driving personalization, productivity, and logistics—rather than standalone ventures.
- Alternative profit streams (credit card, media, travel, financial services) are more explicitly positioned as funding mechanisms to reinvest in member value, not as independent profit centers.
Theme drift or shifts in emphasis
- The narrative evolves from “steady” to “accelerated” warehouse expansion, with growing emphasis on creative formats, relocations, and international complexity.
- Technology commentary shifts from front-end tools and app functionality toward broader AI and data platforms aimed at merchandising, supply chain, and operating efficiency.
Capital allocation signal evolution
- Capital deployment moves from continuation of existing capex priorities toward a more assertive build-out of depots, digital infrastructure, and AI systems, with explicit acceptance of near-term cost for long-term leverage.
- Wage and benefit investments transition from being highlighted episodically to being treated as structural, with a clearer expectation that productivity and technology must structurally offset them.
Risk narrative evolution
- Tariffs, macro uncertainty, and labor/healthcare inflation remain persistent risks, but the framing shifts from acute disruption management toward ongoing, baked-in planning assumptions.
- Digital member growth and international expansion increasingly feature as execution risks—renewal behavior, engagement tactics, permitting, and construction—rather than purely as upside opportunities.
Leverage position & capital efficiency

- The debt-to-capital ratio declined, driven primarily by higher equity, and now sits below historical norms, indicating improved balance-sheet resilience.

- ROIC declined 1.1 pp to 19.3% in 2025, with no single ROIC driver dominating.
- ROE fell 3.4 pp to 27.8% as equity grew faster than net income.
Management on capital structure
- The company provided no balance sheet, capital structure, or liquidity disclosures in the extracted sections, which prevented identification of factors that strengthened or weakened financial flexibility or leverage.
Cash flow and capital allocation
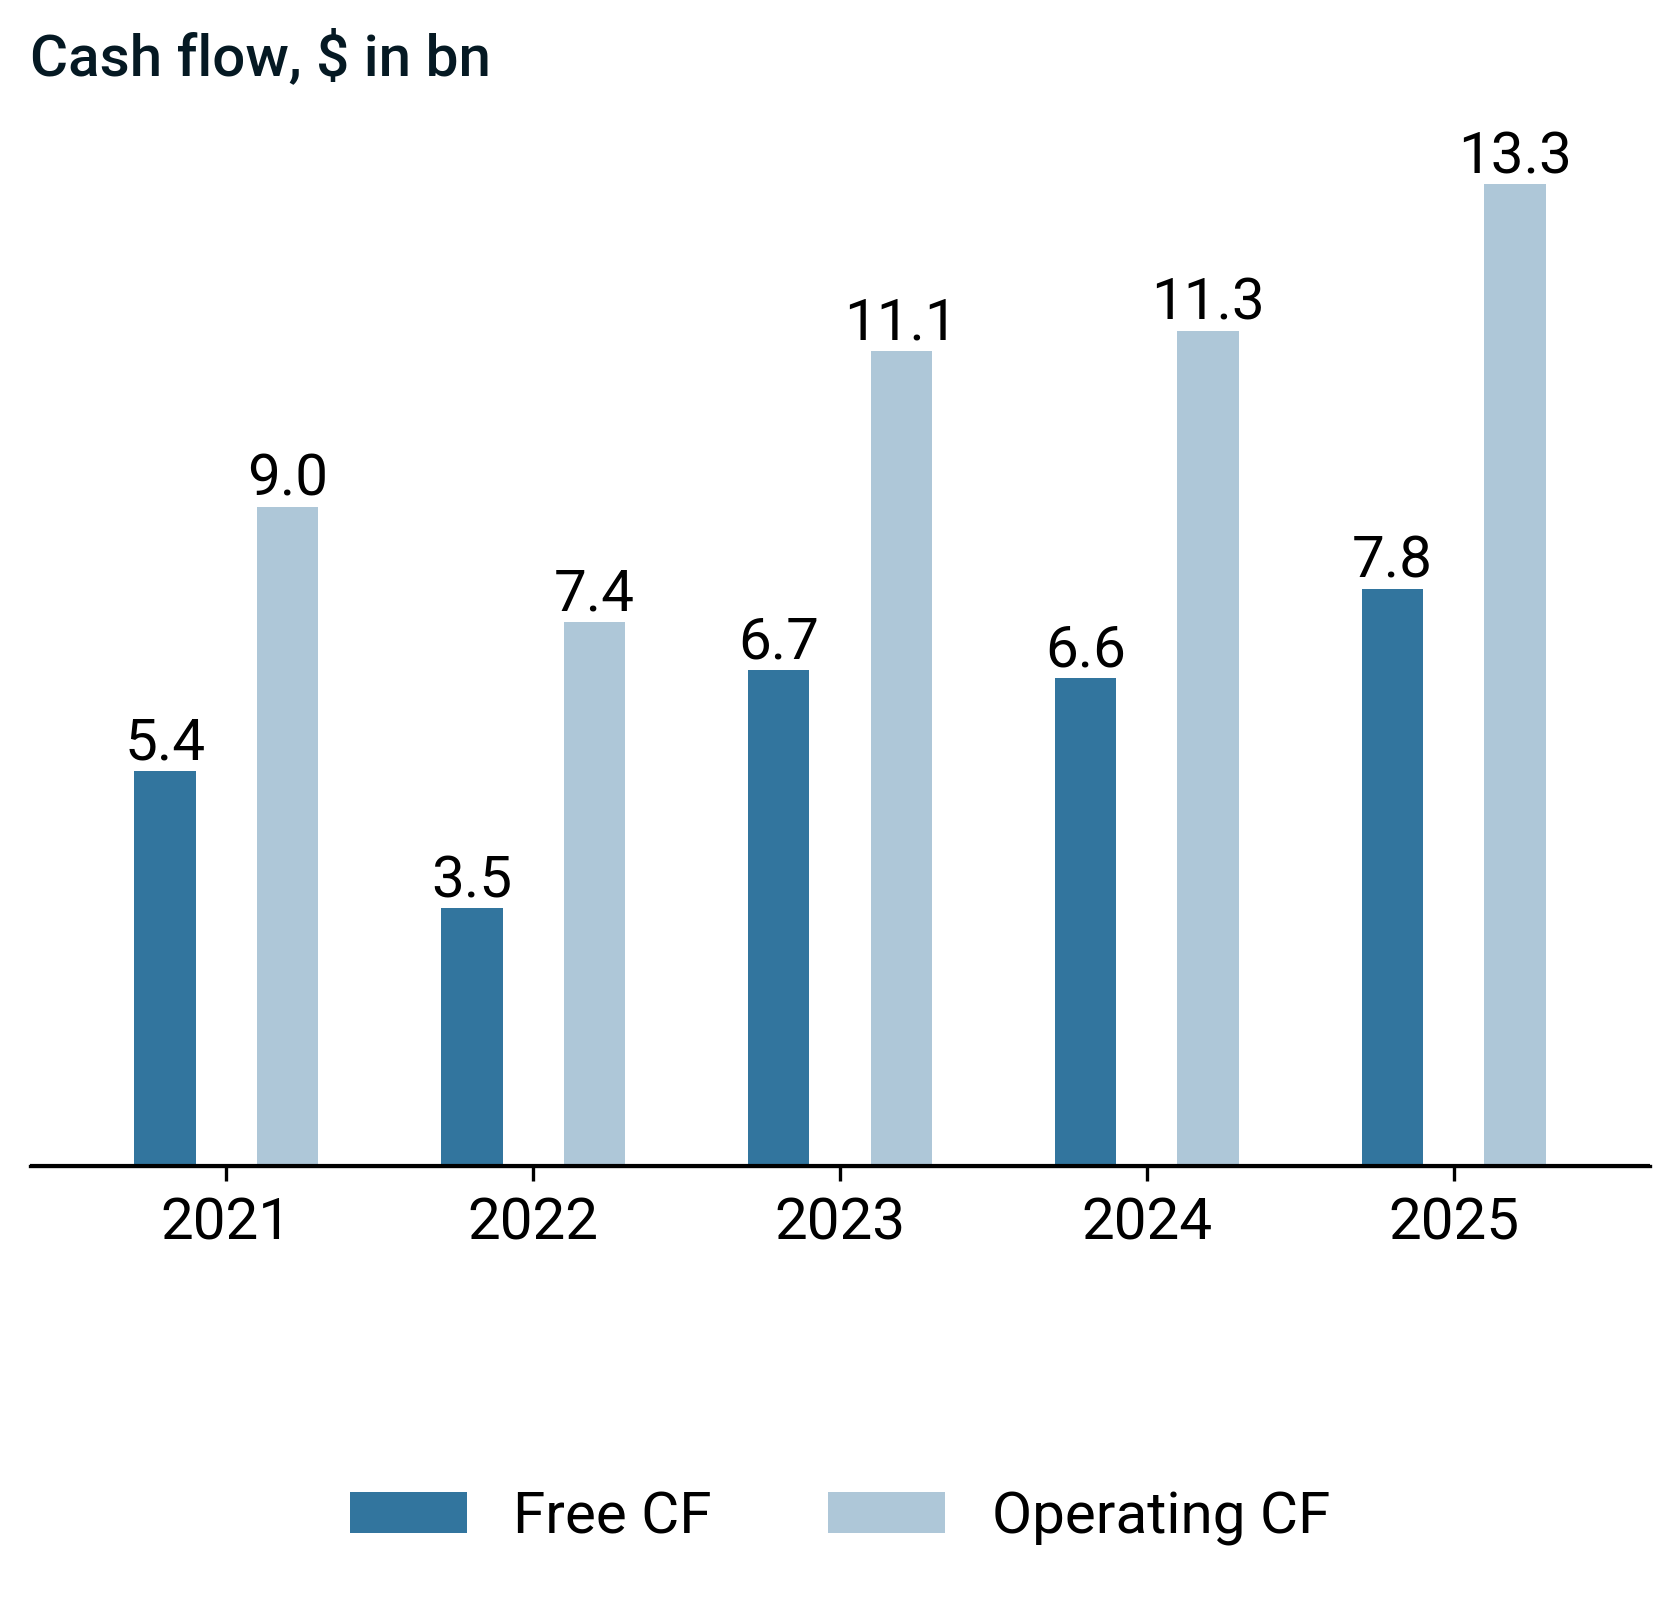
- Free cash flow of $7.8 bn rose, driven primarily by stronger operating cash flow of $13.3 bn despite higher capex of $5.5 bn.
- Investing cash flow outflows intensified to $-5.3 bn, while financing cash flow outflows eased to $-3.8 bn.
- Income quality of 1.6 increased, indicating closer alignment between earnings and cash flow.
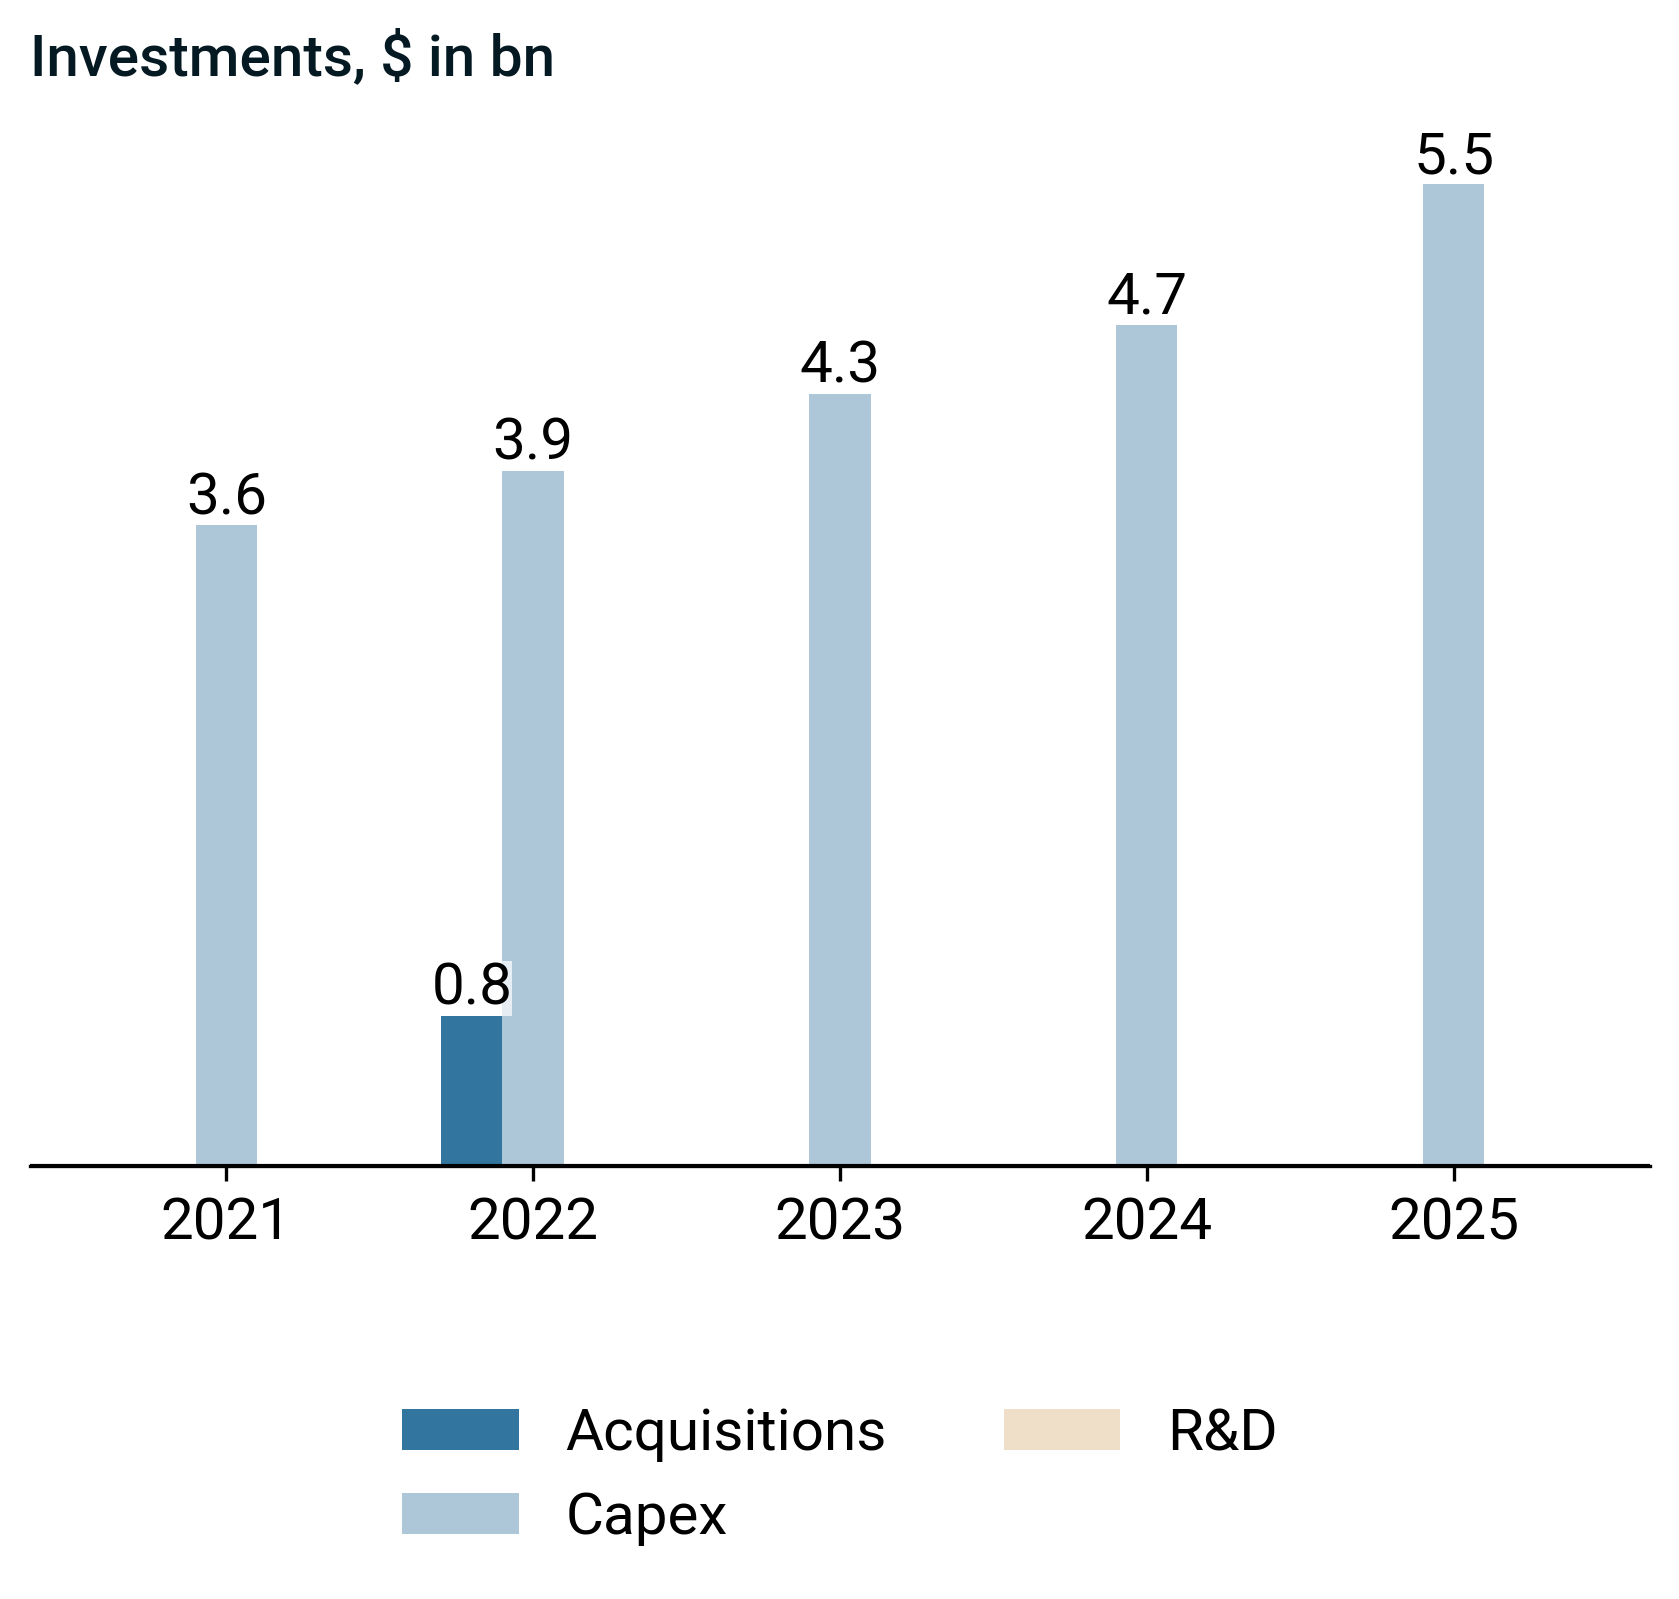
- Capex increased to $5.5 bn, with acquisitions and R&D at $0.0 bn, funded primarily through operating cash flow and exceeding free cash flow.

- 2025 capital returns shifted toward $0.9 bn stock repurchase and sharply lower $2.2 bn dividends paid.
- Stronger $13.3 bn operating cf and $7.8 bn free cf supported these outflows.
Management on capital allocation
- Management provided no disclosed drivers of operating cash flow, capital expenditures, or capital-allocation actions in the extracted sections, which constrained analysis of period-specific cash flow dynamics.
- The filing excerpts did not state any priorities or rationale for share repurchases, dividends, debt management, or reinvestment, which prevented attribution of capital-allocation decisions to underlying strategic or financial objectives.
Valuation (2025-08-31)

EPS increased while the stock price declined, indicating divergent performance between underlying earnings and market returns.

- EV to EBITDA narrowed year over year but remains above its historical norm.
- EV to FCF also contracted yet stays above its historical norm.
- Both moves reflect balanced changes in valuation and fundamentals.
Disclaimer
This presentation is for informational and educational purposes only and does not constitute investment advice, an offer, or a solicitation to buy or sell any security or financial product. The content herein is based on publicly available information, believed to be accurate and reliable at the time of publication, but no representation or warranty, express or implied, is made as to its accuracy, completeness, or correctness.
Any opinions, projections, or forward-looking statements expressed in this material reflect our judgment as of the date of publication and are subject to change without notice. Past performance is not indicative of future results. Investing involves risks, including the potential loss of principal.
The recipient is solely responsible for their own investment decisions and should seek independent financial, legal, and tax advice where appropriate. We disclaim any liability for any direct or consequential loss arising from any use of this presentation or its contents.