Capital Discipline League, FY 2025
Cross-Company Capital Efficiency Ranking
Access the complete report with more detailed charts in PDF presentation format. Capital Discipline League PDF report download
This ranking evaluates 501 S&P 500 companies on 5-year average capital efficiency metrics.
Top 25 Rankings
| Rank | Ticker | Company | ROIC | FCF% | ND/EBITDA | Tier |
|---|---|---|---|---|---|---|
| 1 | TPL | Texas Pacific Land Corpor | 57.7% | 39.8% | -1.0x | Elite |
| 2 | ADBE | Adobe Inc. | 46.8% | 39.8% | -0.1x | Elite |
| 3 | NVDA | Nvidia | 57.7% | 32.7% | 0.7x | Elite |
| 4 | REGN | Regeneron Pharmaceuticals | 57.7% | 31.8% | 0.1x | Elite |
| 5 | ANET | Arista Networks | 57.7% | 32.3% | -0.7x | Elite |
| 6 | TROW | T. Rowe Price | 57.7% | 26.6% | -0.6x | Elite |
| 7 | DECK | Deckers Brands | 57.7% | 16.0% | -1.2x | Elite |
| 8 | IDXX | Idexx Laboratories | 57.7% | 19.5% | 0.7x | Elite |
| 9 | EW | Edwards Lifesciences | 56.6% | 15.6% | -0.4x | Elite |
| 10 | META | Meta Platforms | 57.7% | 27.6% | 0.1x | Elite |
| 11 | NVR | NVR, Inc. | 57.7% | 14.9% | -0.8x | Elite |
| 12 | TER | Teradyne | 57.7% | 17.2% | -0.6x | Elite |
| 13 | MPWR | Monolithic Power Systems | 57.7% | 22.5% | -0.8x | Elite |
| 14 | AMAT | Applied Materials | 52.2% | 23.0% | 0.1x | Elite |
| 15 | MA | Mastercard | 37.9% | 39.8% | 0.5x | Elite |
| 16 | LRCX | Lam Research | 47.4% | 24.3% | -0.0x | Elite |
| 17 | V | Visa Inc. | 38.9% | 39.8% | 0.3x | Elite |
| 18 | FAST | Fastenal | 57.7% | 12.7% | 0.2x | Elite |
| 19 | GOOG | Alphabet Inc. (Class C) | 57.7% | 22.7% | 0.1x | Elite |
| 20 | GOOGL | Alphabet Inc. (Class A) | 57.7% | 22.7% | 0.1x | Elite |
| 21 | MNST | Monster Beverage | 57.7% | 18.2% | -0.8x | Elite |
| 22 | TXN | Texas Instruments | 53.8% | 19.2% | 0.9x | Elite |
| 23 | CPRT | Copart | 57.7% | 22.9% | -0.8x | Elite |
| 24 | DHI | D. R. Horton | 57.7% | 5.8% | 0.4x | Elite |
| 25 | ODFL | Old Dominion | 57.7% | 14.1% | -0.1x | Elite |
Tier Distribution: 53 Elite (11%), 150 Above Average (30%).
Distribution
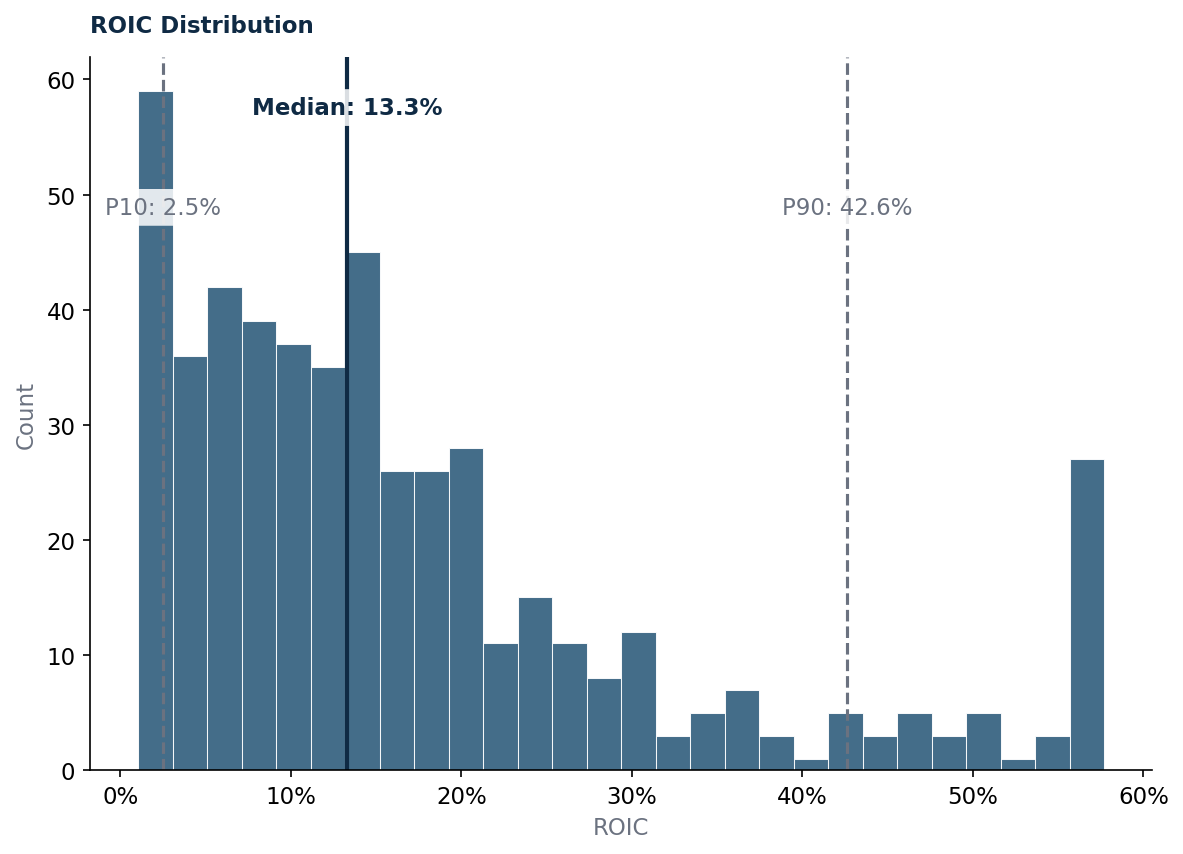
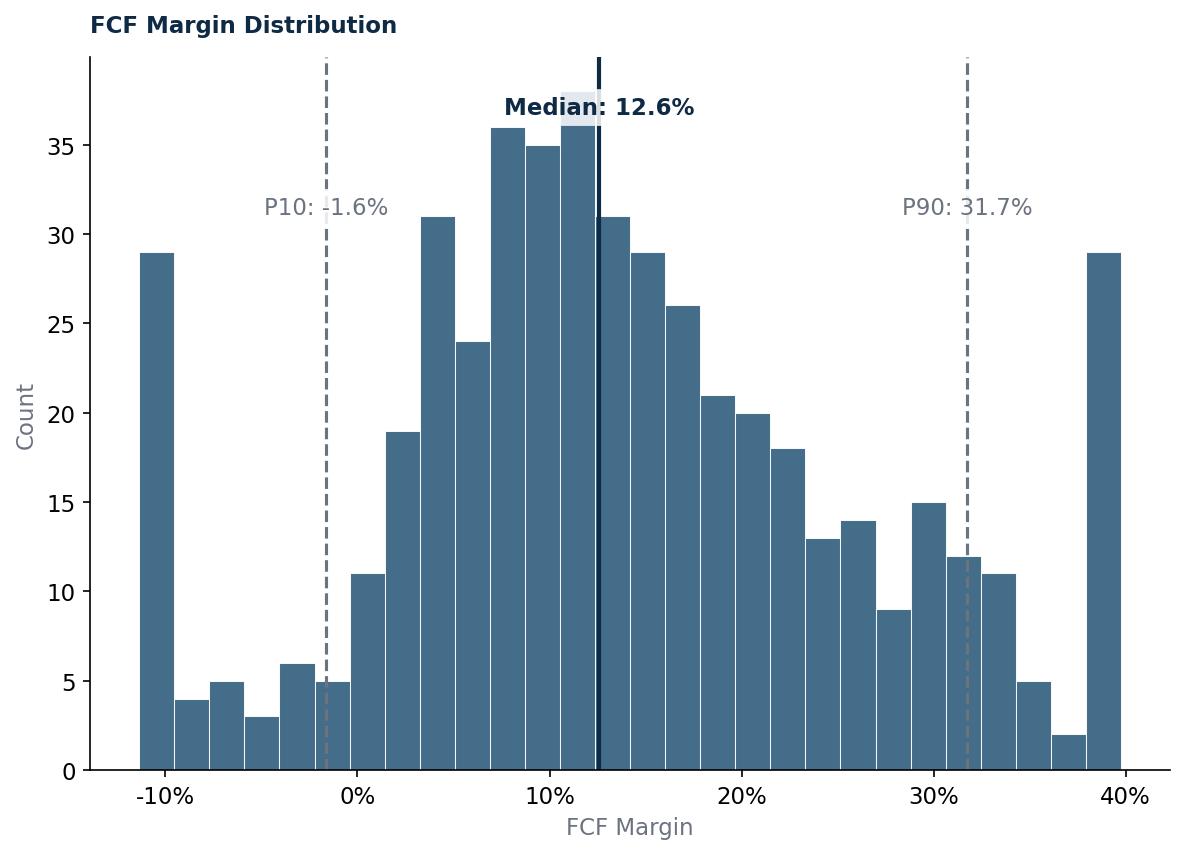
Pattern Analysis
The analysis of these top capital discipline companies reveals a distinct pattern wherein sectors such as Technology, Healthcare, and Financial Services dominate the list, indicating a concentration of high capital efficiency and robust financial metrics in these industries. Companies with elevated return on invested capital (ROIC) averages, such as Texas Pacific Land Corporation and Nvidia, typically leverage proprietary technologies or unique business models that enable them to maintain substantial competitive advantages. Additionally, the presence of strong free cash flow margins across various sectors suggests that these firms are effectively translating their operational efficiencies into substantial capital generation, which can be reinvested for growth or returned to shareholders. Notably, while Technology and Healthcare sectors exhibit some of the highest ROIC averages, their free cash flow margins vary significantly, pointing to diversification in operational strategies and market conditions within these industries.
For informational purposes only. Not investment advice.